Online module on
“Coastal and Marine management”
Responsible for the content: Gerald Schernewski, & Johanna Schumacher
Technical implementation: Steffen Bock
Introduction
This online module provides background information for the university course on “Coastal and Marine Management”. The information is focussed on Europe and the Baltic Sea. Aim is to provide up-to-date information on environmental problems, pressures, policies and management. For this purpose, mainly official documents provided by high-ranking international organizations are utilized.
1. Coastal zones & seas in Europe
In 2006, the European Commission published the following overview on „Maritime facts and figures“ (1):
- From the earliest times, the oceans and seas have played a leading role in the development of European culture, economy, identity and history.
- The continent of Europe is surrounded by four seas: the Mediterranean, the Baltic, the North Sea and the Black Sea; and by two oceans: the Atlantic and the Arctic.
- The maritime surface areas under the jurisdiction of the Member States are larger than the total land area of the European Union.
- The European Union has a coastline of 68 000 km – that is over 3 times longer than that of the US and almost 2 times that of Russia.
- No European resident lives more than 700 km away from the coast.
- Almost half of the Union's population lives less than 50 km from the sea, although the population is concentrated in urban areas along the coast.
The importance of the European coastal regions for the population is visible from the following facts:
- Maritime Regions account for over 40 % of Europe’s Gross Domestic Product (GDP).
- Europe has an estimated 8-10 million anglers fishing for sport or pleasure at sea with a related industry of 8-10 billion Euros.
- The sea is Europe’s most popular holiday destination: among European holiday makers, 63 % choose the sea as their holiday destination.
- Europe has clean beaches: of the 14 000 coastal bathing areas monitored by the EU, 96.7 % comply with the mandatory values set out in the European Directive on bathing water.
- There are an estimated 3 000 coastal marinas in the EU with an associated 1 000 000 berths.
- EU public expenditure dedicated to coastline protection against the risk of erosion and flooding will average €5.4 billion a year for the period 1990-2020.
- Between 3 and 5 % of Europe’s Gross Domestic Product (GDP) is estimated to be generated from sea-related industries and services, without including the value of raw materials, such as oil, fish or gas.
- Almost 90 % of the EU’s external trade and over 40 % of its internal trade are transported by sea.
- 5 billion tonnes of cargo per year and 350 million passengers pass through the 1 200 European seaports.
Sources:
1.1. Definitions
Coastal zone: The terms 'coastal zone' means the land‐sea interface, however a generally accepted definition does not exist. Commonly used is “the interface between land and sea, defined as the part of the land affected by its proximity to the sea (influence of marine processes), and the part of the sea affected by its proximity to the land (influence of terrestrial processes) (1).“
However, for planning purposes sometimes fixed boundaries are defined e.g. zone between shoreline and 3 km inland from the coast (Danish Planning Act, 1991) or a strip between shoreline and 200 m landwards (Spanish Shores Act, 1988).
Other definitions are based on physical processes, for example: „a region a few kilometres wide on either side of the shoreline where local thermal circulations such as the sea breeze and land breeze occur“ (2) or ”…coastal zones include the splash zone, the high intertidal zone, the low intertidal zone, and the low tide zone“ (3). In some cases the coastal zone is defined seawards up to the continental shelf edge.
Littoral zone (shoreface): “is part of the active coastal zone, situated seaward of the low water line. This zone extends seaward from the foreshore to some distance beyond the breaker zone. The littoral zone is the zone in which littoral morphodynamic processes take place, related mainly to longshore sediment transport and cross-shore sediment transport…” The width of the instantaneous littoral zone varies dependent of the wave conditions.” (4)
Coastline: “Technically the line that forms the boundary between the coast and the shore, i.e. the foot of the cliff or the foot of the dunes. Commonly, the line that forms the boundary between the land and the water. See also: Classification of coastlines.” (4)
Shoreline: “The intersection between the mean high water line and the shore. The line delineating the shoreline on Nautical Charts (Sea Maps) approximates this Mean High Water Line. The shoreline is not easy to identify in the nature in contrast to the coastline, which is based on a clear morphological shift between the shore and the coast.” (4)
Transitional waters: in the European Union, the definition is “bodies of surface water in the vicinity of river mouths which are partly saline in character as a result of their proximity to coastal waters but which are substantially influenced by freshwater flows.” (European Water Framework Directive, 2000/60/EC). Estuaries, lagoons and several semi-enclosed bays are addressed as transitional waters.
Coastal waters: represent the interface between land and ocean. In the European Union, coastal waters form a belt between the baseline (transitional waters) as landward boundary and one nautical mile (1.8 km) offshore of the baseline (European Water Framework Directive, 2000/60/EC). The baseline represents an official simplified coastline. Usually the outline of islands, mouths of rivers or bays are connected by straight baselines.
Territorial waters: is a belt of coastal waters extending at most 12 nautical miles from the baseline of a coastal state (United Nations Convention on the Law of the Sea, 1982)
Coastal seas: usually means the sea between coastline and continental shelf edge. It includes the enclosed and semi-enclosed European seas, the regional seas, such as the Mediterranean Sea (2,500,000 km2 surface area, 1,500 m average depth), the Black Sea (508,000 km2 1,240 m), the North Sea (575,000 km2, 94 m) and the Baltic Sea (422,000 km2, 55 m).
Sources:
1.2. Utilization of Europe's coasts and seas
“Coastal zones are among the most productive areas in the world, offering a wide variety of valuable habitats and ecosystems services that have always attracted humans and human activities. The beauty and richness of coastal zones have made them popular settlement areas and tourist destinations, important business zones and transit points” (1).
In 2017, the European Environmental Agency published the report ‘State of Europe’s seas’. It provides a comprehensive overview about the utilization of coastal seas in Europe (2):
Extraction of living resources: Over the past ten years, EU-27 total catches in all fishing regions have been in steady decline. The EU is increasingly dependent on imports of the most widely consumed species: tuna, cod and salmon. Extraction of genetic resources from the sea for the purposes of biotechnology is in the early stages of growth. It is expected to increase significantly in the future.
Production of living resources: Aquaculture accounts for a significant portion of seafood supply in the EU. Marine aquaculture production is increasing in Europe, mostly due to salmon production in Norway. Fin fish production accounts for most of the increase in European aquaculture production in recent years. Aquaculture production of shellfish has been decreasing since 2004. Since 2007, production of aquatic plants has also been a growing sector.
Extraction of non-living resources and disposal of waste: Europe's seas contain valuable mineral and aggregate resources, as well as space to store and dispose of unneeded materials. The disposal of waste and the extraction of non-living resources such as marine aggregates, sand, and gravel are often driven by growth in other industries, for instance the high-tech or construction industries. It is expected that marine mining will see continued growth to meet the demands of high-tech industries. Desalination has grown in recent years, and is expected to continue to grow in order to meet demand for drinking water.
Transport and shipbuilding: Maritime transport of freight in Europe grew between 2002 and 2011. Passenger ferry services have seen a slight decline in passengers in recent years, although the sector remains highly significant for some Member States. The shipbuilding and ship-repair industries are expected to grow in the coming years, driven by a demand for new technologies to reduce the environmental impact of the shipping industry.
Tourism and recreation: Tourism and recreation are an important motor of the European 'blue' economy. Coastal areas are the top tourist destination in Europe, and marine and coastal tourism are expected to continue to grow.
Man-made structures: Man-made structures of various types in marine and coastal areas lead to multiple pressures on the environment. Changes such as sea-level rise and increased coastal storms may lead to new growth in the coastal-protection industry. The three largest European port operations, Rotterdam, Hamburg, and Antwerp are located on the North Sea coast.
Energy production - offshore renewables: Offshore wind power installations in Europe have greatly increased in number in the past decade. Installations are concentrated almost exclusively in northern Europe. Although offshore wind power is predicted to continue to grow in the future, it is expected that its growth rate will somewhat decrease due to high investment costs and a lack of political commitment. Wave and tidal power are considered to be a large untapped source of clean power, and are predicted to increase in importance in the next few years.
Energy production - oil and gas: Marine hydrocarbon extraction is declining in Europe but is still an important part of the maritime economy.
„In summary, Europe's seas provide a vast amount of valuable resources. It is estimated that maritime activities contribute around EUR 467 billion in annual GVA and 6.1 million jobs to the economy. Moreover, projections indicate that Europe's seas will deliver increasing value in the future across most activities“ (2).
Sources:
1.3. Pressures on Europe's coasts and seas
The intensive concentration of population and excessive exploitation of natural resources puts enormous pressure on coastal ecosystems leading to biodiversity loss, habitats destruction, pollution, as well as conflicts between potential uses, and space congestion problems” (1).
In 2017, the European Environmental Agency published the report ‘State of Europe’s seas’. The results clearly reflect that intensive human activities are causing serious disturbances on and pollution of coastal zones and seas (2):
- Fishing occurs over a wide spatial area and is the main activity that causes seafloor damage. The impact of human activities affecting the deep seafloor is of increasing concern. Currently, most (74%) of the EU's fishing fleet effort results from mobile gears which disturb the seafloor.
- Due to the partial decrease in fishing pressure since 2007, some stocks in the North-east Atlantic Ocean and Baltic Sea are now exploited at sustainable levels. In the Mediterranean and Black Seas, the majority of commercially-fished species remain overfished. Fishing affects the wider ecosystem beyond fish stocks. It causes changes to ecosystem structure and functioning, altering species interactions and ecosystem resilience.
- Non-indigenous species (NIS) that become invasive are a key threat to biodiversity and ecosystem health. Their impacts are generally widespread and irreversible. The number of NIS in European waters continues to increase, with around 320 new species observed since 2000. More than 1 400 non-indigenous marine species have been introduced in Europe's seas. The main pathway of introduction is shipping followed by aquaculture-related activities.
- Eutrophication continues to be a major environmental problem. It is responsible for widespread environmental degradation in the Baltic and Black Seas. Oxygen-depleted zones are a serious and growing consequence of eutrophication. The environmental problems created by eutrophication reduce the quality of ecosystem services.
- Hazardous substances are widespread in the marine environment, due to the persistent nature of many substances and the continuous introduction of new ones. Targeted policy efforts have led to a reduction in the use of some of these contaminating substances, and some substances have been banned. Unfortunately, there are many more substances in the environment where the status is not known. Hazardous substances can accumulate through the marine food chain and can pose health risks to humans who regularly consume significant amounts of seafood.
- Marine litter — and plastic in particular — is accumulating in the world's oceans. European seas are also experiencing this problem. Most of the litter comes from land-based sources, except in the North-East Atlantic where sea-based litter is equally important. Micro-plastics are of growing concern because they build up in the food web. Their effects on wildlife and the risk they pose to human health are still poorly understood.
- Europe's seas are increasingly the site of industrial activities (e.g. shipping, renewable energy, oil and gas extraction, and defence activities). This results in increased underwater sound — the most widespread kind of energy introduced by man. Underwater noise can cause a range of impacts in marine animals, from subtle behavioural changes to injuries and death in extreme cases.
Coastal zones and seas are also among the most vulnerable areas to climate change and natural hazards. Risks include flooding, erosion, sea level rise as well as extreme weather events. These impacts are far reaching and are already changing the lives and livelihoods of coastal communities.
Sources:
1.4. State of Europe's seas
As consequence of the large amount of uses and activities in the coastal zone and the resulting pressures and pollution of the coastal seas, the European Environmental Agency conclude in their report ‘State of Europe’s seas’ from 2017 that Europe's seas cannot be considered to be in a healthy state. Several major messages are (1):
- For species results show that 27% of marine species assessments were considered to be in 'unfavourable conservation status'. The observed loss of biodiversity affects ecosystem functioning and may cause irreversible loss of ecosystem resilience.
- There is a great diversity of seabed habitats across the different regional seas of Europe, with over 1 000 different seabed habitat types identified. 66% of the biogeographic assessments showed 'unfavourable conservation status'.
- Over 650 marine fish species are thought to inhabit European seas. Most of the assessed commercial fish stocks (58%) are not in 'good environmental status' (GES), while 40% of EU catches remain unassessed.
- There are over 180 species of marine birds found throughout Europe's seas, and many of these undertake yearly migrations between feeding and breeding grounds. We can tentatively conclude that approximately one third of marine bird populations are declining, one third are stable, and one third are growing.
- Almost 40% of the world's known marine mammal species can be found in Europe's regional seas. In some regions, marine mammal populations are in unfavourable conservation status.
- Food webs are one of the main regulators of ecosystem dynamics. They play a role in the way ecosystems respond to natural and human-induced changes. Slight changes in food webs can lead to dramatic changes in an ecosystem. These dramatic changes are called 'ecological regime shifts'. Ecological regime shifts in marine ecosystems have been observed in a number of Europe's regional seas.
An unsustainable use of our coasts and seas threatens the services these ecosystems provide to humans and, human activities that depend on the sea directly suffer from damaged ecosystems. In this respect we have to take into account that seas additionally have a large intrinsic value. For example, they provide a free horizon, enable recreation or to experience wildlife. Therefore, adequate planning and management are needed to ensure the health of the seas and to maximise the sustainable socio‑economic benefits they provide (2).
Beside the multiple pressures resulting from direct human activities, climate change is another major threat for the function and structure of coastal systems. Increasing sea level (1,7 mm/year) changes the shape of coastlines, contributes to coastal erosion and leads to flooding and more underground salt-water intrusion (2). Increasing water temperatures will have strong effects on ecosystems and decrease biodiversity.
In twelve brief lessons, the “Ocean Atlas 2017” provides interesting additional facts about the utilization and threats of the oceans (3).
Sources:
2. Integrated Coastal Zone Management (ICZM)
Depending on context, background and national tradition, Integrated Coastal Zone Management (ICZM) is also called Integrated Coastal Management, Coastal Zone Management or simply Coastal Management.
Several terms are used for concepts and approaches that share similar objectives with ICZM, like Integrated Coastal Area Management (ICAM), Integrated Coastal Resources Management, Coastal Area Planning or Sustainable Coastal Zone Development.
“Because the well-being of populations and the economic viability of many businesses in coastal zones depend on the environmental status of these areas, it is essential to make use of long term management tools, such as integrated coastal management, to enhance the protection of coastal resources whilst increasing the efficiency of their uses. A sectoral approach, leads to disconnected decisions that risk undermining each other, to inefficient use of resources and missed opportunities for more sustainable coastal development.
Integrated coastal management aims for the coordinated application of the different policies affecting the coastal zone and related to activities such as nature protection, aquaculture, fisheries, agriculture, industry, off shore wind energy, shipping, tourism, development of infrastructure and mitigation and adaptation to climate change.” (1)
Definition: “Integrated Coastal Zone Management” is a dynamic, multi-disciplinary and iterative process to promote sustainable management of coastal zones. It covers the full cycle of information collection, planning (in its broadest sense), decision making, management and monitoring of implementation. ICZM uses the informed participation and co-operation of all stakeholders to assess the societal goals in a given coastal area, and to take actions towards meeting these objectives. ICZM seeks, over the long-term, to balance environmental, economic, social, cultural and recreational objectives, all within the limits set by natural dynamics.
"Integrated" in ICZM refers to the integration of different objectives and also to the integration of several instruments that are needed to meet these objectives. It means the integration of all relevant policy areas, sectors, and levels of administration. It means the integration of terrestrial and marine components of the target territory, in both time and space (2).
ICZM combines a horizontal (across disciplines), vertical (across hierarchies), spatial and temporal integration. An approach where stakeholders are actively involved in the process is called participatory.
Definition: an “ecosystem based approach” describes an approach that respects the limits of natural resources and ecosystems, balancing ecological, economic, and social goals and objectives toward sustainable development
Sources:
2.1. Sustainable Development and Agenda 21
Definition: Sustainable development is a development that meets the needs of the present without compromising the ability of future generations to meet their own needs (1).
The Agenda 21 resulted from the United Nations Conference on Environment & Development (Earth Summit), 1992 in Rio de Janeiro. It “addresses the pressing problems of today and also aims at preparing the world for the challenges of the next century. It reflects a global consensus and political commitment at the highest level on development and environment cooperation. Its successful implementation is first and foremost the responsibility of governments. National strategies, plans, policies and processes are crucial in achieving this. International cooperation should support and supplement such national efforts…” (2).
Section II addresses the “conservation and management of resources for development” in altogether 14 chapters. Chapter 17 covers “Protection of the oceans, all kinds of seas, including enclosed and semi-enclosed seas, and coastal areas and the protection, rational use and development of their living resources.” It lists 7 programme areas which require concrete actions:
- Integrated management and sustainable development of coastal areas, including exclusive economic zones (EEZ);
- Marine environmental protection;
- Sustainable use and conservation of marine living resources of the high seas;
- Sustainable use and conservation of marine living resources under national jurisdiction;
- Addressing critical uncertainties for the management of marine environments and climate change;
- Strengthening international, including regional, cooperation and coordination;
- Sustainable development of small islands.
Under management-related activities, the “implementation of integrated coastal and marine management and sustainable development plans and programmes at appropriate levels” is explicitly mentioned.
Under data and information related activities it asks to “Develop and maintain databases for assessment and management of coastal areas and all seas and their resources; Develop socio-economic and environmental indicators; Conduct regular environmental assessment of the state of the environment of coastal and marine areas; Prepare and maintain profiles of coastal area resources, activities, uses, habitats and protected areas based on the criteria of sustainable development; Exchange information and data” (2)
This very detailed and demanding Agenda 21 strongly influenced the European Union’s environmental policy and initiated the development of the coastal and marine policy.
In 2015, the heads of state and government and high representatives, met at the United Nations headquarters in New York and agreed on the 2030 Agenda for Sustainable Development. This agenda contains 17 new global sustainable development goals. Goal 14: “Conserve and sustainably use the oceans, seas and marine resources for sustainable development”. Sub-goal 14.5: “By 2020, conserve at least 10 per cent of coastal and marine areas, consistent with national and international law and based on the best available scientific information” (3).
The 2030 Agenda for Sustainable Development has initiated the regional Baltic 2030 Action Plan that calls on all countries in the Baltic Sea Region (BSR) to help realize a common vision of sustainable development (4).
Sources:
2.2. ICZM history in Europe
The United Nations Earth Summit of Rio de Janeiro in 1992 initiated the development of focussed European Union policy on Integrated Coastal Zone Management (ICZM) (1).
“From 1996 to 1999, the European Commission operated a Demonstration Programme on Integrated Coastal Zone Management to provide technical information about sustainable coastal zone management, and to stimulate a broad debate among the various actors involved in the planning, management or use of European coastal zones” (1).
The programme was intended to lead to a consensus regarding measures necessary in order to stimulate Integrated Coastal Management in Europe. In 2000, based on the experiences and outputs of the Demonstration Programme, the Commission adopted two documents:
The first document was the Communication from the Commission to the Council and the European Parliament on ‘Integrated Coastal Zone Management: A Strategy for Europe’ (COM/2000/547 of 17 Sept. 2000)” (1).
This document states that “the basic bio-physical problem in the coastal zones is that development is not kept within the limits of the local environmental carrying capacity” (2). Some of the most common manifestations are widespread coastal erosion, habitat destruction, loss of biodiversity, contamination of soil and water resources and problems of water quality and quantity.
These problems cause or interfere with human-related problems, namely:
- unemployment and social instability resulting from the decline of traditional or environmentally-compatible sectors, such as small scale coastal fisheries
- competition between users for resources
- destruction of cultural heritage and dilution of the social fabric following uncontrolled development (especially of tourism)
- loss of property and development options, as the coast erodes
- lost opportunities for durable employment, as resources degrade
- marginalization and emigration, compounded by a lack of appropriate infrastructure
Although each coastal zone faces different specific problems, the coastal management case studies within the Demonstration Programme show that these specific problems have the same root causes (2):
- Management of the coast has lacked vision and is based on a very limited understanding of coastal processes and dynamics; scientific research and data collection have been isolated from end-users
- There has been inadequate involvement of the stakeholders in formulating and implementing solutions to coastal problems
- Inappropriate and uncoordinated sectoral legislation and policy have often worked against the long-term interests of sustainable management of coastal zones
- Rigid bureaucratic systems and the lack of coordination between relevant administrative bodies have limited local creativity and adaptability
- Local initiatives in sustainable coastal management have lacked adequate resources and political support from higher administrative levels.
Conclusions are that “it is essential to implement an environmentally sustainable, economically equitable, socially responsible, and culturally sensitive management of coastal zone, which maintains the integrity of this important resource” (3). Further, that “integrated management of the coastal zone requires action at the local and regional level, guided and supported by an appropriate framework at the national level” (3).
The second document was a proposal for the implementation of an Integrated Coastal Zone Management in Europe (COM/2000/545 of 8 September 2000). This Recommendation was adopted by the European Parliament and Council on 30 May 2002 (2002/413/EC).
On 12 March 2013 the Commission adopted a proposal for a Directive establishing a framework for maritime spatial planning and integrated coastal management” (1). The final Directive (2014/89/EU) on establishing a framework for maritime spatial planning was adopted in 2014. In this Directive that is legally binding for all EU Member States, ICZM was deleted from the title. Major ideas and the concept of ICZM are still included in the directive, but it had the consequence that ICZM and coastal related activities lost momentum in Europe.
This development indicates a shift in the focus and perception of ICZM. Originally, ICZM had a strong environmental focus and implemented the idea of an ecosystem approach to management. Today, in Europe, ICZM largely lost its autonomy and became part of maritime spatial planning.
Sources:
2.3. ICZM Recommendations for Europe (2002)
An outcome of the policy document “Integrated Coastal Zone Management: A Strategy for Europe" (1) is the “Recommendation on ICZM”. It was perceived as a milestone for ICZM, because it defined principles for a successful coastal zone management and defined tasks for EU Member States (2):
“Principle 1: A broad overall perspective (thematic and geographic) which will take into account the interdependence and disparity of natural systems and human activities with an impact on coastal areas
Principle 2: A long-term perspective which will take into account the precautionary principle and the needs of present and future generations
Principle 3: Adaptive management during a gradual process which will facilitate adjustment as problems and knowledge develop. This implies the need for a sound scientific basis concerning the evolution of the coastal zone
Principle 4: Local specificity and the great diversity of European coastal zones which will make it possible to respond to their practical needs with specific solutions and flexible measures
Principle 5: Working with natural processes and respecting the carrying capacity of ecosystems, which will make human activities more environmentally friendly, socially responsible and economically sound.
Principle 6: Involving all the parties concerned (economic and social partners, the organisations representing coastal zone residents, non-governmental organisations and the business sector) in the management process, for example by means of agreements and based on shared responsibility.
Principle 7: Support and involvement of relevant administrative bodies at national, regional and local level between which appropriate links should be established or maintained with the aim of improved coordination of the various existing policies. Partnership with and between regional and local authorities should apply when appropriate.
Principle 8: Use of a combination of instruments designed to facilitate coherence between sectoral policy objectives and coherence between planning and management” (1).
The Recommendation on ICZM asks EU Member States:
- to conduct a stocktaking to analyse which major actors, laws and institutions influence the management of their coastal zone;
- to develop a national strategy or to implement the principles for integrated management of the coastal zone;
- to enter into a dialogue with coastal stakeholders and neighbouring countries and
- to report to the Commission on the experience;
An EU ICZM Expert group, consisting of Commission, Member States, Candidate countries and relevant European coastal interest or stakeholder groups facilitated the implementation of the EU ICZM Recommendation. However, being a recommendation, it is not legally binding but relies on voluntary actions by EU Member States.
Sources:
2.4. ICZM in Regional Seas
The document ‘Integrated Coastal Zone Management: A Strategy for Europe’ of the year 2000 guided the EU coastal policy during the next decade. It defined 7 fields of activity, among them ‘Promoting ICZM Activity within the Member States and at the Regional Seas’, ‘Developing Best ICZM Practice’ and ‘Generating Information and Knowledge about the Coastal Zone’ (1).
Baltic sea region: “The EU is contracting party to the Helsinki Convention, covering the Baltic Sea. HELCOM Recommendations of specific interest to ICZM include: the Protection of the Coastal Strip (15/1 of 1994), the Preservation of Natural Coastal Dynamics (16/3 of 1995), the Implementation of Integrated Marine and Coastal Management of Human Activities in the Baltic Sea Area (24/10 of 2003) and the Development of Broad-scale Maritime Spatial Planning Principles in the Baltic Sea Area (28E/9 of 2007). In 2010, HELCOM set up a common working group with VASAB (Visions and Strategies around the Baltic Sea), to assist cooperation in the Baltic Sea on ICZM and Maritime Spatial Planning. VASAB adopted in 1996 Common Recommendations for Spatial Planning of the Coastal Zone in the Baltic Sea Region, and has been actively developing and supporting coastal management” (2).
Black Sea: “The EU is not a contracting party to the Bucharest Convention covering the Black Sea. But the Member States Romania and Bulgaria are party to the Convention and participate in its ICZM activities. The Strategic Action Plan for the Environmental Protection and Rehabilitation of the Black Sea, adopted in 2009 establishes ICZM as one of its 3 key management approaches” (2).
Mediterranean: A milestone in the development of international legislation on ICZM was achieved by the adoption of ICZM to the Barcelona Convention. The ‘Protocol on Integrated Coastal Zone Management in the Mediterranean’, is the first supra-national (21 countries located in Europe, Africa and Asia), legally-binding ICZM agreement. The ICZM Protocol was signed in 2008. To date, ten countries and the EU have ratified it. Following the ratification by six countries until 2011, the Protocol entered into force. The ratification includes the European Union and is legally binding for all Member States. Formally, it addresses recent ICZM demands, provides a vision of sustainable development, defines the coastal zone, has legitimacy, a hierarchy of strategies and plans as well as a coherence of governance and actions. It is outcome focused, provides process guidelines for each stage and is interactive and expandable (3).
European ICZM case studies: To support and ensure the exchange of experiences and best practices in coastal planning and management, the project OURCOAST compiled systematic descriptions of 350 coastal management case studies from all over Europe in a joint database. OURCOAST focused in particular on adaptation to risks and the impacts of climate change, information and communication systems, planning and land management instruments, and institutional coordination mechanisms. It was a joint effort of the European Commission, Member States, coastal regions and networks to promote, support and implement ICZM in Europe (4).
Sources:
- https://eur-lex.europa.eu/legal-content/EN/TXT/PDF/?uri=CELEX:52000DC0547&from=EN
- http://ec.europa.eu/environment/iczm/background.htm
- Shipman, B., 2012. ICZM2.0 - a new ICZM for an era of uncertainty. VLIZ Special Publication, 61: 11
- http://ec.europa.eu/environment/iczm/practice.htm
2.5. State of ICZM (in Europe)
Until 2010 the EU Member States provided reports on the national implementation of the ICZM Recommendation, among them Lithuania and Germany (1). The EU Strategy on ICZM and the subsequent ICZM Recommendations caused a lot of activities all over Europe. Many stakeholder workshops took place, national strategies were developed and the awareness about problems in the coastal zone as well as ICZM as a concept to deal with these problems increased.
However, the problems in our coastal zones are not solved and the competition for space is increasing. The European Environmental Agency concludes that these multiple uses and resulting pressures cause serious and increasing problems for coastal habitats and ecosystems. Further, we have challenges like climate change that put additional pressure on the coastal zone. For example, climate change causes sea-level rise, increasing erosion and subsequently beaches are lost. Narrower beaches on one side meet an increasing demand for beaches because of growing tourism and an ongoing concentration of the population along the coast. This is called ‘coastal squeeze’, meaning less space is facing a higher demand for space.
ICZM was meant as a solution to deal with these coastal problems and it is still urgently needed. However, during the last years it has vanished from the national and European political agenda. What went wrong?
During Littoral 2012, Brian Shipman concluded that ICZM is slow in development and is losing ground to rivals, mainly Marine Spatial Planning. He stated that the status quo, how we manage our coasts is not an option and that we must reinvent ICZM so that it is more relevant, easy-to-use, interactive and essential (2). When Brian Shipman said so, he had in mind the Barcelona Convention with its Protocol on ICZM. In 2012, the action plan for the implementation of the Protocol 2012-2019 was adopted (3). It caused several activities around the Mediterranean. However, if we have a look back it did not reach a re-vitalization of ICZM and a move towards the suggested ICZM 2.0 in Europe, in general.
Despite all efforts, ICZM still suffers from weaknesses, e.g. insufficient political and legal status or the lack of a consistent and applicable process for practitioners and policy makers. Existing ICZM case studies often understand the term in a more general, broader sense without implementing major ideas in a convincing way. Concrete lessons learnt that can be transferred to other case studies and have relevance for ICZM in practice are still largely lacking.
However, the ideas of ICZM are widely accepted and aspects are included in most recent strategic and policy documents and directives. Most important in this respect is the EC-Directive on ‘establishing a framework for maritime spatial planning’ of 2014 (4). In the final version, the term ICZM was deleted from the title, but the directive kept major ICZM elements. “In order to take into account land-sea interactions …. Member States may use other formal or informal processes, such as integrated coastal management. The outcome shall be reflected by Member States in their maritime spatial plans.” (4).
But how shall ICZM look like in practice? Brian Shipman (2012) outlined the demand: ICZM has to be politically robust and legitimate, coherent in its outcomes and benefits and with a clear guidance of how to achieve them (2). Most important in this respect is the development of a systematic, stepwise, user-friendly approach that covers the entire ICZM cycle and enables scientists in cooperation with practitioners to deal with coastal problems and challenges.
Sources:
- http://ec.europa.eu/environment/iczm/nat_reports.htm
- Shipman, B., 2012. ICZM2.0 - a new ICZM for an era of uncertainty. VLIZ Special Publication, 61: 11
- http://iczmplatform.org/page/iczm-protocol-and-action-plan
- https://eur-lex.europa.eu/legal-content/EN/TXT/HTML/?uri=CELEX:32014L0089&from=EN
3. Integrated Coastal Zone Management cycle
ICZM is a stepwise, iterative and circular process. Iterative because during any step it may turn out that one of the previous steps was insufficient, that preconditions or perceptions have changed. As consequence, steps may have to be modified or repeated. Circular because finishing all steps causes an improved understanding of the coastal system, its drivers and interactions. This may open new opportunities and/or a better awareness of threats and risks and may require to run the ICZM process again. Further, after some time, new uses, pressures or measures may occur and may make a new ICZM process necessary. Traditionally an ICZM cycle contains the following steps: Initiation, Planning, Implementation as well as Monitoring and Evaluation (1).
This traditional view of an ICZM as a circular and iterative process is still valid. However, it turned out that this approach is too vague to be suitable for practical applications and that it was hardly concrete enough for local case studies. As consequence, the Systems Approach Framework (SAF) has been developed.
Systems thinking is the process of understanding how things influence one another within a whole. It is defined as “an approach to problem solving, by viewing ‘problems’ as parts of an overall system, rather than reacting to specific parts, outcomes or events and potentially contributing to further development of unintended consequences. It focuses on cyclical rather than linear causes and effects” (3).
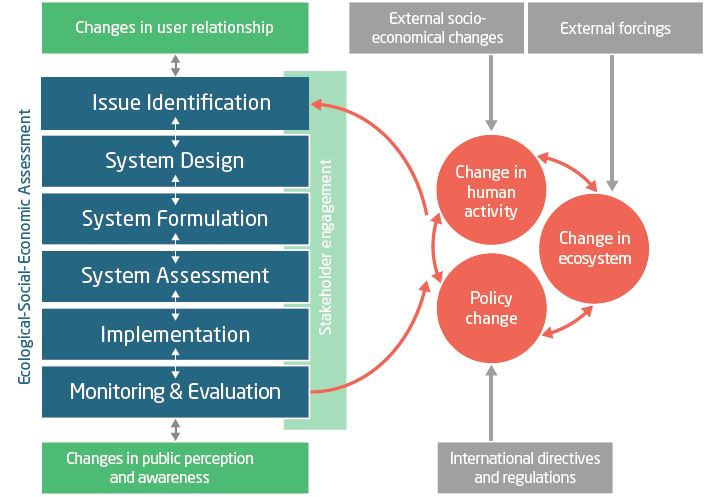
The Systems Approach Framework builds upon systems thinking and provides a stepwise guide to sustainable ICZM. It is meant to overcome a major weakness of the traditional ICZM process and shall allow shortening the time between recognition of a problem until the implementation of a sustainable solution. The SAF itself as well as all 6 steps are documented in an online handbook (2). This entire chapter strictly follows and reflects its content.
According to Tom Hopkins (2011), the SAF is “a framework to allow a team to develop a management strategy; based on interaction between science, policy and stakeholders; multidisciplinary and stringent in its application.”
The SAF is not a tool in itself; a replacement for legislation; a quick exercise; something that can be implemented by a single person
Aim of the SAF is to “develop and test a structure for processing and evaluating multidisciplinary and trans-disciplinary information to enable environmental managers and policy-makers make sustainable solutions concerning the coastal zone, in order to improve ecological sustainability, economic efficiency, and social equity” (3).
The SAF guides the ICZM process in 6 steps:
- Issue Identification
- System Design
- System Formulation
- System Assessment
- Implementation
- Monitoring & Evaluation
The Ecological-Social-Economic (ESE) Assessment is the core of the SAF (blue boxes in the figure) is conducted in collaboration with stakeholders throughout all the steps. A SAF application from Issue Identification to Implementation can be conducted within 12 to 18 months with an experienced team.
Sources:
3.1. Issue Identification
The first step in the Systems Approach Framework (SAF) is the Issue identification (1). It initiates the SAF process to achieve ICZM. It is about scoping the project, outlining the critical preliminary actions and setting the scene for undertaking community participation.
The Issue is usually a problem or a conflict that needs to be resolved. A solution needs to be found and implemented. However, if the system is not viewed as a whole, the decision may only have addressed the needs of one sector. Before you know it, a new conflict arises with new actors. The problem becomes a never-ending story, where the managers use resources defending unsustainable decisions and potentially non-compliant citizens oppose, resist or challenge the decision and its implementation. With the SAF, decision making becomes a collaborative process.
At the end of the Issue identification step you will have decided whether or not to initiate a SAF cycle and you have formed a core SAF team with the necessary expertise to conduct the work and have engaged the stakeholders that will be involved in the SAF application.
It should be kept in mind that the SAF application can be terminated during this step if the Issue is too simple or too complex to be applied with the available resources.
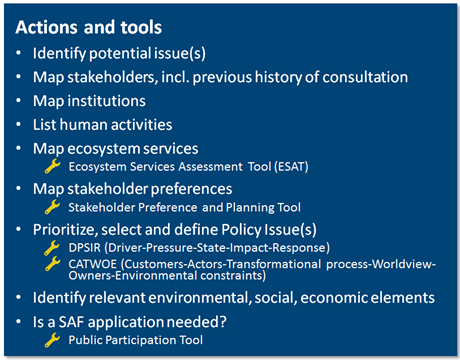
Open the handbook (1) and click on each of the actions
Sources:
3.2. System Design
The second step in the Systems Approach Framework (SAF) is the System Design (1). During the System Design you develop the conceptual model for the virtual system related to the policy issue. This is where you assess data availability, define the various boundaries for your system, define success criteria and identify indicators and discuss potential management options with stakeholders. These management options will form the basis for scenario simulations in the next SAF step.
The System Design step of the SAF consists of a list of actions (figure). By the end of the System Design step you have a conceptual model with clearly defined Ecological-Social-Economic (ESE) linkages, defined boundaries of the virtual system and have an overview of available data.
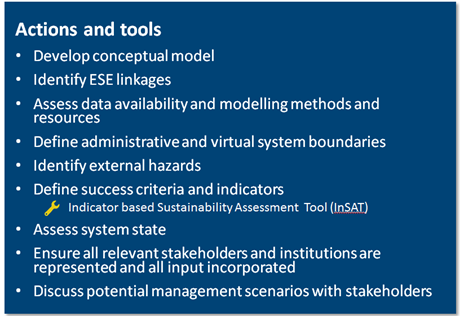
Open the handbook (1) and click on each of the actions.
Sources:
3.3. System Formulation
The third step in the Systems Approach Framework (SAF) is the System Formulation (1).
During this step, we formulate and test the individual Ecological, Social and Economic (ESE) components of the scenario simulation model (sub-models), test model sensitivity, validate the model components, merge them into an integrated ESE model and run scenario simulations.
Here, we work to organize available data and information to empirically represent the system functioning (state and processes) in order to be able to simulate consequences of different management options.
We formulate the individual model components, the environmental, social/cultural and economic model blocks based on input data as well as output data from auxiliary models. This includes identification of all state variables (response variables) and all drivers (explanatory variables, co-variates) needed to simulate the processes relevant to each model component. Also, we identify and formulate the linkages between the ESE model components and merge them into the ESE model.
If independent data are available, we test and validate the individual ESE sub-model components, as well as the integrated ESE model. Finally, we run simulations of the potential scenarios chosen by the stakeholders and prepare the output for stakeholder deliberation in the next step, System Assessment.
By the end of the system formulation step you have a complete ESE model (i.e. a bio-economical model) with which you can simulate the various scenarios chosen collaboratively by managers and stakeholders.
During this step, consultations with managers and stakeholders are vital to gain their acknowledgement and ownership of the model, and thereby trusting the modelling output. All stakeholders involved have gained a better insight to the problem and better awareness of how decisions may affect different parts of the system, different sectors and different stakeholders.
The system formulation step of the SAF consists of a list of actions (figure).
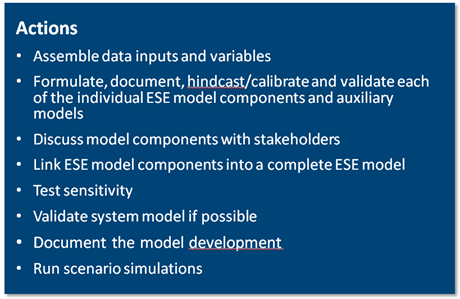
Open the handbook (1) and click on each of the actions.
3.4. System Assessment
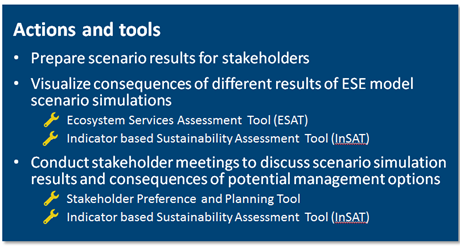
The fourth step in the Systems Approach Framework (SAF) is the system assessment (1). At the starting point of the system assessment step, the simulation analyses are completed and the results ready to be discussed with all stakeholders. The simulation results need to be processed in a manner that is easy to communicate to stakeholders.
At the end of the system assessment step you should have a good overview of the consequences of potential management options to resolve the Issue. You have a good overview on the knowledge and perceptions of all stakeholders involved and on potential reactions to decisions.
Open the handbook (1) and click on each of the actions.
3.5. Implementation
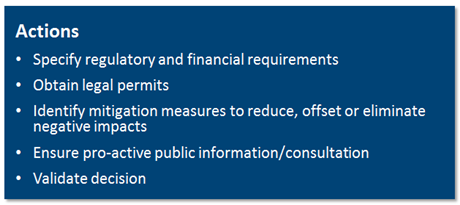
The fifth step in the Systems Approach Framework (SAF) is the implementation (1). The implementation step is where the managers take responsibility of implementing the most likely decision reached through the SAF process so far.
How well this step progresses illustrates in part how successful the SAF has been in science-policy integration and stakeholder engagement.
External factors can also hinder this step of the SAF such as political change, governance restructuring or other external events such as natural disasters, economic crisis or social unrest.
At the end of the implementation step a Policy decision has been made and implemented.
Communication with the stakeholders involved has allowed them to recognize how their input has contributed to the decision and how the decision is being implemented.
The successful completion of the step reflects accountability and transparency embedded in a robust governance system. It enhances citizen trust and support.
Open the handbook (1) and click on each of the actions.
3.6. Monitoring & Evaluation
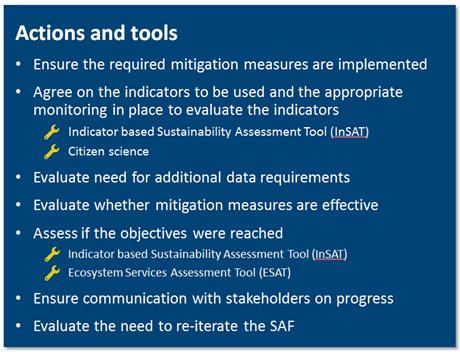
The sixth step in the Systems Approach Framework (SAF) is monitoring and evaluation (1). This monitoring and evaluation step is important to evaluate if the outcomes and objectives have been reached or if adjustments need to be made.
The monitoring can be implemented soon after the implementation step, whereas the evaluation can take longer and can be considered beyond the time-frame of a SAF application.
Open the handbook (1) and click on each of the actions.
4. ICZM Tools & Approaches
In order to promote a successful implementation of coastal and marine policy, supporting tools that can be applied to support decision-making are needed, in order to reach a sustainable management of the coastal and marine environment. So called Decision Support Tools (DSTs) cover a wide variety of tools including quantitative assessment tools, model-based management tools or tools that support participation processes and that can cover a variety of components, ranging from environmental descriptors (e.g. biodiversity and pollution) to economic or social evaluations.
In the context of ICZM there is strong need for DSTs that can support the participation process throughout the steps of the ICZM cycle. For instance, quantitative models, GIS-based mapping tools, or indicator-based assessment tools can be used in combination with qualitative information within stakeholder workshops, in order to provide information to the participants or to extract information or opinions of the participants.
Numerous DSTs to support ICZM or MSP have been developed, but their application in practice often remains low. Consequently, user-friendly and freely available tools, which can be applied with little technical skills and in a variety of contexts are needed. In the following sub-chapters several DSTs that are easily applicable and can be used to support participation processes within the ICZM cycle will be introduced.
4.1. DPSIR/DAPSI(W)RM Framework
The DPSIR Framework is commonly used in environmental management to describe interactions and relationships between society and the environment in a holistic way. The acronym stands for Drivers, Pressures, State Change, Impact and Response. More recently, the framework has been refined to DAPSI(W)RM, in which “Drivers of basic human needs require Activities which lead to Pressures. The Pressures are the mechanisms of State change on the natural system which then leads to Impacts (on human Welfare). Those then require Responses (as Measures).” The DPSIR/ DAPSI(W)RM Framework can be used to describe the cause-and-effect chain of a problem.
Drivers are basic human needs (e.g. air, food, sleep, protection), including psychological needs (e.g. relationships, trust, independence, prestige) and self-fulfilment needs (e.g. self-fulfilment, seeking personal growth).
Activities can be broadly grouped into sectors (e.g. aquaculture, fisheries, renewable energy, tourism/recreation), which are composed of many activities (e.g. fish aquaculture, mussel cultivation; bottom trawling, pelagic fishing; construction of wind farms, power generation; cruise ship tourism, angling, bathing).
Pressures result from activities and reflect the mechanism of change and can lead to changes in the natural system. They can be grouped into pressures that are outside of the system and cannot be managed in the particular area (e.g. temperature, salinity, sea level changes due to climate change) and those that occur and can be managed within the system boundaries (e.g. under water noise, litter, barrier to species movement; water flow rate changes, input of nutrients).
State Changes relate to changes in the natural environmental system and are caused by single or multiple pressures. These can be changes in physico-chemical parameters (e.g. dissolved oxygen, organic matter) and changes in the biological organisation (e.g. ecosystem structures, loss of biodiversity).
Impacts (on human Welfare) result from changes in the natural system and have consequences for societal welfare. As such, they reflect (positive or negative) changes to the provision of goods and benefits for society.
Those require Responses (as Measures), that is, management responses which can be economic, legal or technical including adaptation measures, technical solution, restrictions, emission reductions, restoration and maintenance. (1)
Within Coastal Management and SAF the DPSIR/ DAPSI(W)RM Framework can be applied to:
- Help to generate a common understanding of an issue/problem, its causes and consequences
- Provide a good basis for generating conceptual models to analyse a problem in more detail
4.2. CATWOE Analysis
CATWOE stands for Customers-Actors-Transformations-Worldview-Owner-Environment. The CATWOE Analysis was originally developed for business problems, but can also be applied to problems within coastal and marine management. The analysis helps to brainstorm and broaden ones thinking and perspective about a particular problem. This is done, to avoid that the core problem is neglected, only single symptoms are addressed or conclusions are drawn to quickly. Applying CATWOE helps to explore functional relationships between people (stakeholders) that are affected by a particular problem and to understand the complex nature of various actors and their interactions and identify the key problems that need to be solved. The six element of CATWOE are described below with additional questions that should support the analysis:
Customers: Victims or beneficiaries of Transformations (Who is on the receiving end? What problem do they have now? How will they react to new management options? Who are the winners and losers?)
Actors: Those, who would do Transformations
Transformational Processes (T): Conversion of input and output
(What are the inputs and where do they come from? What are the outputs and where to they go to? What are the steps in between?)
Worldview: Meaningful context of Transformations
(What is the bigger picture into which the situation fits (may differ among stakeholders)? What is the real problem for each stakeholder? What is the wider impact of any solution?)
Owners: Those, who can stop Transformations
(Who can help or stop you? What will cause them to get in your way? What will lead them to help?)
Environment: Unchangeable elements outside the system
(What are the external constraints and limitations affecting the success of the solution? What are the ethical limitations, laws, financial constraints, limited resources, regulations? How might these constraint your solutions? How might you get around them?)
Within Coastal Management and SAF the CATWOE Analysis can be applied to:
- Gain a broader understanding of a problem
- Map stakeholders that might be affected by the issue and should be included in the participation process
4.3. Participation and Stakeholder Engagement
According to the Aarhus Convention, the public, that is individuals and their associations, has a right to access environmental information and to participate in environmental decision-making. Consequently, public participation is a fundamental principle within all EU environmental policies, and is for instance required by the Water Framework Directive (WFD), Marine Strategy Framework Directive (MSFD), Maritime Spatial Planning Directive (MSPD) and Habitats Directive (HD).
Public participation is a process in which the concerns, needs and values of the public are incorporated into decision making. However, different levels of participation exist, ranging from passive dissemination of information to active engagement. In international documents, three levels of participation are recognized:
- “Access to information is the first, basic and important right which is underlying the whole process of participation. Whilst it means that the government informs the public about its plans and the types of documents it wants to adopt at the beginning of the process, it also highlights the right of the public to have access to all information (e.g., drafts, comments and reasoning) throughout the process.” (1)
- “Consultation is a form of participation where the government invites the public to provide its opinion, comments, views and feed-back on a specific document. Whilst the issues on which the public is consulted are defined by the government, this process should also allow for the public to express opinion on other issues contained in the draft. Consultation can be organized with a broader group of participants from the public.” (1)
- Active involvement (partnership) means collaboration and jointly undertaken responsibilities at all stages of the decision-making process (agenda setting, issue identification, drafting, decision and implementation).” (1)
In general, participation within Coastal Management and within SAF refers to the third level and should include an active and early involvement of stakeholders. In contrast to the general public, the term stakeholder is more context specific and refers to anybody who has an interest in or, is affected by a decision. This can include those who cause a problem, are affected by a problem, are affected by a solution or are affected by doing nothing.
Engaging stakeholders early in the planning process is considered to be beneficial in order to allow exchange and avoid conflicts, to increase understanding and develop a shared perception of a problem, to enable joint decision making, and to generate local knowledge.
At the same time, disagreements among stakeholders and lacking experiences in participatory approaches among managers or responsible authorities have been among the limiting factors in ICZM case studies. Major weaknesses in stakeholder engagement identified within several ICZM case studies include a late and unbalanced involvement of stakeholder groups. In several cases, the dominance of single stakeholders or stakeholder groups caused polarisation and public outcries and prolonged the planning and implementation process (examples are shown in sections 8.2 and 8.3). In such cases, stakeholder engagement can be costly, time-consuming, labour-intensive and potentially create new conflicts or lead to the escalation of existing ones and ultimately delay the process. Hence, facilitating heterogenic stakeholder groups in order to keep discussions thematically focused and avoiding dominance of single persons or groups can be a major challenge. In order to ensure a successful participatory process, clear objectives, skilled facilitation and supporting tools are needed.
4.4. Stakeholder Preference and Planning Tool
The Stakeholder Preference and Planning Tool can be used as a supporting tool in order to guide stakeholder discussion systematically and keep them thematically focused. It allows to assess stakeholder preferences for future development of specific management options or scenarios. For this, the relative importance of pre-defined parameters or success criteria are assessed in a facilitated stakeholder discussion.
Within Coastal Management and SAF the Stakeholder Preference and Planning Tool can be applied to:
- Raise awareness about sustainability and assess stakeholder preferences for future development of an area
- Enable thematically focused stakeholder discussion and guide them systematically
- Generate a common understanding of an issue and/or potential management options
- Identify concrete success criteria that should be achieved after the implementation of a final measure
- Assess if stakeholder preferences change over time (if applied repeatedly)
- Evaluate different management options based on stakeholder preferences
In the first step, stakeholders are asked to identify success criteria that should be fulfilled when a management option has been implemented. In a second step, these success criteria are inserted into a matrix and pairwise comparisons are made between any two criteria. For each comparison a score is given on a scale from 1/7 to 7. The score 1/5 indicates that the criterion on the Y-axis is less important than the criterion on the X-axis. The score 5 indicates that criterion on the Y-axis is more important than the criterion on the Y-axis. The scores 1/7 and 7 indicate “much” and the scores 1/3 and 3 “slightly” higher or lower importance. The score 1 indicates that both criteria are equally important.
After all comparisons have been made and a consensus score has been entered for each comparison, a relative importance (weight) is automatically calculated for each criterion.
Furthermore, the perceived suitability of different management options can be assessed with the Stakeholder Preference and Planning Tool. For this, all options are compared within the matrix and scored according to their suitability to fulfil each success criterion.
The tool is easily applicable for non-experts and can be adjusted to other needs (e.g. ranking issues, assessing conflicts). Furthermore, it can be used as a basis to develop concrete indicators to assess the success of a measure (see section 4.5 Indicator-based Sustainability Assessment Tool).
4.5. Ecosystem Services
The 2020 Biodiversity Strategy was the first EU policy to highlight the “immense value of ecosystem services and the urgent need to maintain and restore these for the benefit of both nature and society” (1) and requires EU member states to map and assess their ecosystem services.
Ecosystem Services (ES) are defined as “the benefits humans obtain from ecosystems” - these can be direct (e.g. food, raw materials) or indirect (e.g. regulation of water supply and quality, nutrient cycling). As such, the ES concept has a strong anthropocentric focus and does not include biophysical structures and processes (e.g. vegetation cover, primary production) or functions (e.g. slow passage of water) that do not directly or indirectly contribute to human well-being.
In the past 15 years the ES concept has gained increasing interest in research, policy and decision making, and a wide range of ES approaches emerged. With the aim to provide a standardized classification of ES the “Common Classification of Ecosystem Services” (CICES) was developed. It includes three categories of ES, that is provisioning (e.g. firewood, food), regulating (e.g. climate regulation, water purification) and cultural services (e.g. recreation, scenic values) and describes them in a five-level hierarchical structure which consists of Sections (e.g. Provisioning), Divisions (e.g. Biomass), Group (e.g. Reared animals for nutrition, materials or energy), Classes (e.g. Animals reared by in-situ aquaculture for nutritional purposes) and Class types (e.g. Animals by amount, type) and covers both, biotic and abiotic ecosystem outputs. The hierarchical structure provides flexibility for ES assessments to address different spatial scales and levels of information (2).
ES assessment methods and tools can be broadly grouped into quantitative (data-based) and qualitative (expert-based) assessments. The choice of method or tool depends on the assessment purpose, required outputs and practical considerations such as time efforts, data availability and required expertise.
First quantitative ecosystem services assessments focused on monetary valuations. A study by Robert Constanza and others (1997) estimated that the global economic value of the ecosystem services is in a range between USD 16-55 trillion, of which 63% were considered to be contributed by coastal and marine ecosystems. Despite the high level of uncertainty, monetary valuations can be beneficial for including non-market values into cost-benefit analyses in order to better reflect the value of ecosystems or to show the socials costs of ecosystem loss. Furthermore, they can be used for compensation mechanisms in order to compensate e.g. landowners for good management practices that support conservation. Other quantitative methods make use of monitoring, modelling or spatially explicit data. Quantitative methods are for instance used to develop baselines to monitor changes over time or for evaluating implications of management decisions or policy changes. Qualitative assessments are often considered to be more subjective, but are practical for scoping and identifying relevant services and prioritising sites for in-depth research, identifying stakeholder groups that benefit from particular services, and to bring people together to think about ES values and management implications. (3)
Sources:
4.6. Marine Ecosystem Services Assessment Tool
The Marine Ecosystem Services Assessment Tool (MESAT) was developed to address the knowledge gap regarding the assessment of ES in coastal and marine environments. It assesses changes in ES provision between two points in time (an initial/past and a present status) and can be applied in a qualitative (expert-based) or in a semi-quantitative (data-based) way.
It is based on CICES and includes 31 ES, assessed by 54 indicators. The indicators are assessed for both points in time (usually representing a time period of 5 years to reduce the effects of annual variations). The difference between the indicator values are allocated into a numerical scale with logarithmic increase. It has 11 categories of change (CC): five positive (“1.1 to 1.3”, “1.3 to 1.7”, “1.7 to 2.5”, “2.5 to 4.1” and “>4.1”), five negative (“-1.1 to -1.3”, “-1.3 to -1.7”, …, “<-4.1”) and one class representing no change (“-1.1 to 1.1”). Each indicator value for the initial status is multiplied by the category borders to give the range of values defining each category of change. The user then compares the value of the indicator for the present status with the intervals and for each category of change and assigns the corresponding CC. For representation purposes, the scale is simplified to “1 to 5” representing an increase in ES provision, “-1 to -5” representing a decrease in ES provision” and “0” representing no changes.
The tool automatically generates graphical outputs for different CICES hierarchical levels. For the data collection, different sources such as empirical data (databases), reports and scientific literature, other sources such as model outputs and internet sources, and expert knowledge can be used.
Within Coastal Management and SAF MESAT can be applied to:
- Analyse the development of a water body over time
- Compare changes in ecosystem services between different water bodies or systems
- Assess future development scenarios
- Compare different management options
4.7. Sustainability Indicators
Coastal Management aims to promote sustainable development of coastal zones. Increasing pressures in coastal areas, but also ICZM policy requirements (e.g. Agenda 21, SDGs) have resulted in efforts to develop indicator sets to measure the state and progress towards sustainability in coastal areas. Indicators are considered to provide a simplified view on complex phenomena, quantify information and make it comparable, and facilitate communication and are used within European environmental policies to describe the present and future state of the environment. Thus, indicators are regarded as important tools in European coastal and marine policy and have been used for many years to monitor the EU Sustainable Development Strategy. In order to assess the degree and success of ICZM implementation in the EU, a working group on indicators and data (WG-ID) was set up, and developed two sets of indicators: 1) an indicator set to measure the progress of implementation of ICZM (progress indicators) and 2) a set of indicators to measure sustainable development of the coastal zone (sustainability indicators), which covered environmental, social and economic aspects. Subsequently, both sets were tested within several European projects (e.g. DEDUCE, CoPraNet, COREPOINT).
Since then numerous indicator sets to assess coastal sustainability have been developed on local, regional, national, European and global scale. Within the project SUSTAIN an indicator-based method to measures sustainability on a local level was developed in cooperation with coastal communities. It consists of an indicator application in which municipalities can conduct a self-assessment of their state of sustainability. In a second step, the sustainability pillars (environmental quality, economics, social well-being and governance) and supporting issues (e.g. air pollution, sustainable mobility) are weighted in a facilitated weighting exercise based on their importance. This promotes a discussion and exchange between stakeholders, which can be used to develop a vision for future development and raises awareness about sustainability issues. Furthermore, combining both steps helps to adjust the indicator set to local situation. Yet, in general acceptance on a local and regional level remained low. Reasons for this include lacking expertise, limited access to data, time and resource constraints, low relevance and lack of immediate and concrete benefits for coastal communities.
Besides assessing sustainability and progress of ICZM implementation on different spatial levels, indicators can also be applied to concrete case studies in order to assess the success of measures. Hereby, they can be used to evaluate whether a measure leads or led to progress towards sustainability and to what extent the process followed the principles of ICZM and steps of the ICZM cycle. As such they can be applied during different steps of the ICZM cycle or the SAF, for instance during the System Assessment to evaluate different management options with respect to their implications on sustainability, or during the Monitoring & Evaluation step to assess, whether the measure and its planning and implementation process was successful.
4.8. Indicator-based Sustainability Assessment Tool
The Indicator-based Sustainability Assessment Tool (InSAT) serves as a user-friendly tool to support coastal and marine management, with particular focus on sustainability and incorporates environmental, social, and economic aspects. The indicator set is provided in an EXCEL spreadsheet format and can be tailored to the strategic goal and requirements of ICZM initiatives. The three categories Environmental Quality, Economics and Social Well-Being are used to assess changes in the state of sustainability. They are further subdivided into several sub-categories and assessed based on altogether 36 core indicators which have to be answered, and 39 optional indicators that can be selected. The fourth category “Process” consists of 14 core indicators and evaluates the management process. The application process of InSAT consists of six steps:
- Step 1: Identification of Management Initiative Objective
- Step 2: Determination of Management Options and Targets
- Step 3: Selection of Indicators
- Step 4: Collection of Data
- Step 5: Assessment and Evaluation
- Step 6: Monitoring and Reporting
The selection of indicators is based on different criteria, such as the scope, relevance and data availability. Data is collected in order to score each indicator. The scoring for the sustainability indicators is done in a qualitative way, using a 7 point Likert scale ranging from -3 (strong negative effects) to 3 (strong positive effects). Process indicators are scored on a scale from 0 (no, not at all) to 4 (yes, fully). Final scores for each category are automatically calculated as averages.
Within Coastal Management and SAF InSAT can be applied to:
- Assess impacts of a measure/ management option on environmental, social and economic components of a system
- Assess and illustrate strengths and weaknesses of different measures/ management options
- Support discussions during the development of management options
- Assess and compare success and sustainability of different coastal management initiatives
- Re-evaluate implemented measures to assess whether initially agreed upon objectives were reached
5. European Union (EU) Integrated Maritime Policy
The United Nations' 2030 Agenda for Sustainable Development, in particular Sustainable Development Goal 14, has the aim “to conserve and sustainably use the oceans, seas and marine resources” (1). It requires an international ocean governance.
International ocean governance “is about managing and using the world's oceans and their resources in ways that keep our oceans healthy, productive, safe, secure and resilient. Today, 60% of the oceans are outside the borders of national jurisdiction. This implies a shared international responsibility. Under the overarching UN Convention on the Law of the Sea (UNCLOS), a plethora of jurisdictional rights, institutions, and specific frameworks have been set up to organise the way humans use these waters. EU action on international ocean governance aims to build on this framework and work with others to improve the health of this resource which is open to all States” (1).
In the past decade, the European Union has taken action for oceans, for example (1):
- adopted a holistic approach to all marine and maritime issues: the EU Integrated Maritime Policy;
- put in place a robust set of mandatory environmental rules to ensure EU maritime actors use marine resources sustainably, wherever they operate;
- developed an EU-level strategy to boost sustainable and inclusive blue growth, including blue economy considerations in external policies as regards natural resources, energy, trade, development and security;
- put in place regional strategies to address common challenges and opportunities, collaborating closely with non-EU countries and stakeholders from civil society and the private sector;
- earmarked about €350 million a year for marine research, improving cooperation and information-sharing, and making maritime data publicly accessible;
EU Integrated Maritime Policy seeks to provide a more coherent approach to maritime issues, with increased coordination between different policy areas. It focuses on issues that do not fall under a single sector-based policy as well as on issues that require the coordination of different sectors and actors. It does not replace policies on specific maritime sectors. Specifically, it covers these cross-cutting policies (2):
- Blue growth
- Maritime spatial planning
- Sea basin strategies: The Baltic Sea, Black Sea, Mediterranean Sea, North Sea, the Atlantic and the Arctic Ocean – each sea region is unique and merits a tailor-made strategy.
- Marine data and knowledge: it brings together marine data from different sources with the aim of helping industry, public authorities and researchers to find the data and to use them more effectively in order to develop new products and services as well as improving our understanding of how the seas behave.
- Integrated maritime surveillance: providing authorities interested or active in maritime surveillance with ways to exchange information and data.
The Maritime Forum: “aims to improve communication amongst EU maritime policy stakeholders. It allows parties interested in the EU maritime policy to communicate on a common platform.” (3)
Sources:
5.1. EU Blue Growth Strategy
Blue Growth is the European Union long-term strategy to support sustainable growth in the marine and maritime sectors. Seas and oceans are regarded as drivers for the European economy and are considered to have great potential for innovation and growth. It is regarded as “the maritime contribution to achieving the goals of the Europe 2020 strategy for smart, sustainable and inclusive growth. The 'blue' economy represents roughly 5.4 million jobs and generates a gross value added (GVA) of almost €500 billion a year.” (1) However, further growth seems possible in a number of areas which are highlighted within the strategy. The strategy consists of these components:
- Development of sectors that have a high potential for sustainable jobs and growth
- Provision of knowledge, legal certainty and security in the blue economy
- Sea basin strategies to ensure tailor-made measures and to foster cooperation between countries
The sectors that have a high potential for sustainable jobs and growth in Europe are:
Aquaculture: farming finfish, shellfish and aquatic plants is one of the world's fastest growing food sectors, it already provides the planet with about half of all the fish for human consumption. In Europe, aquaculture accounts for about 20% of fish production and directly employs about 85 000 people. The Commission intends to boost the aquaculture sector through the Common Fisheries Policy reform, and in 2013 published Strategic Guidelines presenting common priorities and general objectives at EU level (2).
Coastal and maritime tourism: employing over 3.2 million people, this sector generates a total of € 183 billion in gross value added and representing over one third of the maritime economy. As much as 51% of bed capacity in hotels across Europe is concentrated in regions with a sea border. The coastal and maritime tourism sector has been identified as an area with special potential to foster a smart, sustainable and inclusive Europe. It is the biggest maritime sector in terms of gross value added and employment and is expected to grow by 2-3% by 2020. In 2012, cruise tourism alone represents 330 000 jobs with a direct turnover of €15.5 billion and is expected to grow.
Marine biotechnology: is concerned with the exploration and exploitation of the resulting diverse marine organisms in order to develop new products. Exploration of the sea biodiversity could enable to develop new pharmaceuticals or industrial enzymes that can withstand extreme conditions, and which consequently have high economic value. In the long term, it is expected that the sector will offer high-skilled employment and significant downstream opportunities (3).
Ocean energy: Seas offer vast renewable energy resources. Ocean energy technologies are currently being developed to exploit the potential of tides and waves as well as differences in temperature and salinity. The development of this emerging sector would not only help us to achieve our renewable energy and greenhouse gas reduction targets, but it could fuel economic growth through innovation and create new, high-quality jobs (4).
Seabed mining: The quantity of minerals occupying the ocean floor is potentially large. Seabed mining is concerned with the retrieval of these minerals to ensure security of supply as well as to fill a gap in the market where either recycling is not possible or adequate, or the burden on terrestrial mines is too great. This small sector has been identified as having the potential to generate sustainable growth and jobs for future generations. However, the lack of knowledge of the deep-sea environment necessitates a careful approach. The European Commission is thus engaged in a variety of studies and projects aimed at shedding light on the benefits, drawbacks and knowledge gaps associated with this type of mining (5).
Sources:
5.2. EU Maritime Spatial Planning (MSP)
Competition for maritime space – for renewable energy plants, aquaculture and other uses – has highlighted the need for managing our waters more coherently. Maritime spatial planning (MSP) works across borders and sectors to ensure human activities at sea take place in a more efficient, safe and sustainable way. That is why the European Parliament and the Council have adopted ‘legislation to create a common framework for maritime spatial planning in Europe’ (MSP-Directive) (1).
Maritime spatial planning means a process by which the relevant Member State’s authorities analyse and organise human activities in marine areas to achieve ecological, economic and social objectives (2). Outside of Europe, it is often referred to as marine, instead of maritime, spatial planning. The term ‘marine’ reduces the emphasis on development and stresses nature and environmental protection.
Benefits of MSP are to (1):
- reduce conflicts between sectors and create synergies between different activities;
- encourage investment – by creating predictability, transparency and clearer rules;
- increase cross-border cooperation – between EU countries to develop energy grids, shipping lanes, pipelines, submarine cables and other activities, but also to develop coherent networks of protected areas;
- protect the environment – through early identification of impact and opportunities for multiple use of space;
The MSP Directive lists several minimum requirements that should be taken into account in maritime spatial plans, such as:
- land-sea interactions;
- the ecosystem-based approach;
- coherence between MSP and other processes such as integrated coastal management;
- the involvement of stakeholders;
- the use of best available data;
- transboundary cooperation between Member States;
- and cooperation with third countries.
In Europe, the 23 coastal Member States are obliged to develop a national maritime spatial plan at the latest by 2021. They are free to design and determine the format and content of their maritime spatial plans, including the institutional arrangements and the allocation of maritime activities.
The EU MSP Platform is an online service to share relevant knowledge and experiences, designed to offer support with the implementation of MSP (3).
Sources:
5.3. Maritime Spatial Planning in practice
Charles Ehler and Fanny Douvere provide a 10 step approach to marine (maritime) spatial planning, taking into account ecosystem-based management (1). They pronounce that “MSP does not lead to a one-time plan. It is a continuing, iterative process that learns and adapts over time. The development and implementation of MSP involves a number of steps, including:
- Identifying needs and establishing authority
- Obtaining financial support
- Organizing the process through pre-planning
- Organizing stakeholder participation
- Defining and analysing existing conditions
- Defining and analysing future conditions
- Preparing and approving the spatial management plan
- Implementing and enforcing the spatial management plan
- Monitoring and evaluating performance
- Adapting the marine spatial management process
“These 10 steps are not simply a linear process that moves sequentially from step to step. Many feedback loops should be built into the process. For example, goals and objectives identified early in the planning process are likely to be modified, as costs and benefits of different management measures are identified later in the planning process. Analyses of existing and future conditions will change, as new information is identified and incorporated in the planning process. Stakeholder participation will change the planning process as it develops over time. Planning is a dynamic process and planners have to be open to accommodating changes as the process evolves over time. Comprehensive MSP provides an integrated framework for management that provides a guide for, but does not replace, single-sector planning. For example, MSP can provide important contextual information for marine protected area management or for fisheries management, but does not intent to replace them” (1).
This approach already integrates major ideas of ICZM and clearly shows the close relationship between ICZM and maritime spatial planning. An example is that MSP is perceived as a continuing, iterative and adaptive process that develops in feedback cycles. However, while ICZM focusses on solving concrete problems, MSP remains more conceptual and provides a framework for management. Further, ICZM has a local to regional spatial scale, while MSP spatially covers larger areas, such as national territorial seas or entire seas.
Sources:
- Ehler, Charles, and Fanny Douvere (2009). Marine Spatial Planning: a step-by-step approach toward ecosystem-based management. Intergovernmental Oceanographic Commission and Man and the Biosphere Programme. IOC Manual and Guides No. 53, ICAM Dossier No. 6. Paris: UNESCO.
5.4. Maritime Spatial Planning – a stepwise process
Following the steps, outputs and tasks according to Ehler and Douvere in more detail (1):
- Identifying needs and establishing authority: outputs are a preliminary list of specific problems you want to solve through marine spatial planning and a decision about what kind of authority you need for developing marine spatial planning. The tasks are (1.1) identifying why you need MSP and (1.2) establishing appropriate authority for MSP.
- Obtaining financial support: output is a financial plan that estimates the costs of your MSP activities and identifies alternative means to obtain financing for those MSP activities. The tasks are (2.1) identifying alternative financing mechanisms and (2.2) defining the feasibility of alternative funding mechanisms.
- Organizing the process through pre-planning: outputs are the organization of a marine spatial planning team with the desired skills; a work plan that identifies key work products and resources required to complete the outputs of planning on time; defined boundaries and time frame for analysis and management; a set of principles to guide development of the marine spatial management plan; and a set of goals and objectives for the management area. The tasks are (3.1) creating the MSP team; (3.2) developing a work plan; (3.3) defining MSP boundaries and timeframe; (3.4) defining principles; (3.5) defining goals and objectives and (3.6) identifying risks and developing contingency plans.
- Organizing stakeholder participation: output is a plan indicating who, when and how to involve stakeholders throughout the marine spatial planning process. The tasks are (4.1) defining who should be involved in MSP and (4.2) defining when to involve stakeholders.
- Defining and analyzing existing conditions: outputs are an inventory and maps of important biological and ecological areas in the marine management area and current human activities (and pressures) in the marine management area as well as an assessment of possible conflicts and compatibilities among existing human uses and between existing human uses and the environment. Tasks are (5.1) collecting and mapping information about ecological, environmental and oceanographic conditions; (5.2) collecting and mapping information about human activities; (5.3) identifying current conflicts and compatibilities.
- Defining and analyzing future conditions: outputs are a trend scenario illustrating how the MSP area will look like if present conditions continue without new management interventions; alternative spatial sea use scenarios illustrating how the management area might look when human activities are redistributed based on new goals and objectives; and preferred scenario that provides the basis for identifying and selecting management measures in the spatial management plan. The tasks are (6.1) projecting current trends in the spatial and temporal needs of existing human activities; (6.2) estimating spatial and temporal requirements for new demands of ocean space; (6.3) identifying possible alternative futures for the planning area and (6.4) selecting the preferred spatial sea use scenario.
- Preparing and approving the spatial management plan: outputs are the identification and evaluation of alterative management measures for the spatial management plan; Identification of criteria for selecting alternative management measures; and a comprehensive management plan, including, if needed, a zoning plan. Tasks are (7.1) identifying alternative spatial and temporal management measures, incentives, and institutional arrangements, (7.2) specifying criteria for selecting marine spatial management measures; (7.3) developing a zoning plan; (7.4) evaluating the spatial management plan and (7.5) approving the spatial management plan
- Implementing and enforcing the spatial management plan: output is a clear identification of actions required to implement, ensure compliance with, and enforce the spatial management plan. Tasks are (8.1) implementing the spatial management plan, (8.2) ensuring compliance with the marine spatial management plan and (8.3) enforcing the spatial management plan.
- Monitoring and evaluating performance: outputs are a monitoring system designed to measure indicators of the performance of marine spatial management measures, information on the performance of marine spatial management measures that will be used for evaluation, and periodic reports to decision makers, stakeholders, and the public about the performance of the marine spatial management plan. Tasks are (9.1) developing the performance monitoring program; (9.2) evaluate performance monitoring data; and (9.3) reporting results of performance evaluation
- Adapting the marine spatial management process: outputs are proposals for adapting management goals, objectives, outcomes and strategies for the next round of planning as well as identification of applied research needs. Tasks are (10.1) reconsidering and redesigning the MSP program; and (10.2) identifying applied research needs.
Sources:
-
Ehler, Charles, and Fanny Douvere (2009). Marine Spatial Planning: a step-by-step approach toward ecosystem-based management. Intergovernmental Oceanographic Commission and Man and the Biosphere Programme. IOC Manual and Guides No. 53, ICAM Dossier No. 6. Paris: UNESCO.
6. European Union Environmental Policy
European Union environmental policies are based on specific targets for the years 2020, 2030 and 2050. Most important overall targets in an international context are to combat climate change and promote sustainable development (1).
Climate change: The EU and its member countries take part in international efforts to fight climate change under the UN climate convention. These efforts include international agreements, taking part in the United Nations Framework Convention on Climate Change meetings, and participating in other international forums. The EU and its member countries are required to report their greenhouse gas emissions, climate change policies and measures, and progress towards targets to the UN (1).
Sustainable development: The EU policy aims at implementing the UN's 2030 agenda for sustainable development and its 17 sustainable development goals (1).
With respect to the coastal and marine environment the following policies are most important:
- EU Marine Strategy Framework Directive (MSFD) (adopted in 2008) aims to protect more effectively the marine environment across Europe. It wants to achieve a ‘Good Environmental Status’ (GES) of marine waters and to protect the resource base upon which marine-related economic and social activities depend. (2)
- EU Water Framework Directive (WFD) (adopted in 2000) aims at a ‘Good Ecological Status’ (GES) in all EU ground and surface waters, namely rivers, lakes, transitional waters, and coastal waters. It is not based on national or political boundaries but on river basins including coastal waters. It became part of the more comprehensive MSFD. (3)
- EU Bathing Water Directive (BWD) (adopted in 2006) defines the monitoring and classification of bathing water quality, the management of bathing water quality and the provision of information to the public on bathing water quality (4).
- EU Biodiversity Strategy (adopted in 2011) aims to halt the loss of biodiversity and ecosystem services in the European Union and to help stopping global biodiversity loss (5).
- Habitats and Birds Directives – Natura 2000 (adopted in 1992) aims at the conservation of natural habitats and of wild fauna and flora. Natura 2000 is the associated network of protected areas (6).
- Common Fisheries Policy (introduced in the 1970s) aims to ensure that fishing and aquaculture are environmentally, economically and socially sustainable and that they provide a source of healthy food.
- Climate Change Strategy (adopted in 2013) aims to make Europe more climate-resilient (8).
- EU Floods Directive (adopted in 2007) focusses on the assessment and management of flood risks (9).
- Regional Sea Conventions are cooperation structures set up to protect the marine environment of a specific marine region (10).
Sources:
- https://europa.eu/european-union/topics/environment_en
- http://ec.europa.eu/environment/marine/eu-coast-and-marine-policy/marine-strategy-framework-directive/index_en.htm
- http://ec.europa.eu/environment/marine/eu-coast-and-marine-policy/marine-strategy-framework-directive/index_en.htm
- http://ec.europa.eu/environment/water/water-framework/info/intro_en.htm
- http://ec.europa.eu/environment/water/water-bathing/summary.html
- http://ec.europa.eu/environment/nature/biodiversity/strategy/index_en.htm
- http://ec.europa.eu/environment/nature/legislation/habitatsdirective/index_en.htm
- https://ec.europa.eu/fisheries/cfp_en
- https://ec.europa.eu/clima/policies/adaptation/what_en
- http://ec.europa.eu/environment/water/flood_risk/index.htm
- http://ec.europa.eu/environment/marine/international-cooperation/regional-sea-conventions/index_en.htm
6.1. EU Marine Strategy Framework Directive (MSFD)
The MSFD implements the ecosystem approach to the management of human activities which have an impact on the marine environment and integrates the concepts of environmental protection and sustainable use. (1)
In order to achieve its goal, a ‘Good Environmental Status’ (GES) in all EU marine waters, the Directive divides marine regions on the basis of geographical and environmental criteria: the Baltic Sea, the North-east Atlantic Ocean, the Mediterranean Sea and the Black Sea. All these seas are located within the geographical boundaries of the existing Regional Sea Conventions.
The following 11 qualitative descriptors determine the GES (2):
- Biological diversity is maintained. The quality and occurrence of habitats and the distribution and abundance of species are in line with prevailing physiographic, geographic and climatic conditions.
- Non-indigenous species introduced by human activities are at levels that do not adversely alter the ecosystems.
- Populations of all commercially exploited fish and shellfish are within safe biological limits, exhibiting a population age and size distribution that is indicative of a healthy stock.
- All elements of the marine food webs, to the extent that they are known, occur at normal abundance and diversity and levels capable of ensuring the long-term abundance of the species and the retention of their full reproductive capacity.
- Human-induced eutrophication is minimised, especially adverse effects thereof, such as losses in biodiversity, ecosystem degradation, harmful algae blooms and oxygen deficiency in bottom waters.
- Sea-floor integrity is at a level that ensures that the structure and functions of the ecosystems are safeguarded and benthic ecosystems, in particular, are not adversely affected.
- Permanent alteration of hydrographical conditions does not adversely affect marine ecosystems.
- Concentrations of contaminants are at levels not giving rise to pollution effects.
- Contaminants in fish and other seafood for human consumption do not exceed levels established by Community legislation or other relevant standards.
- Properties and quantities of marine litter do not cause harm to the coastal and marine environment.
- Introduction of energy, including underwater noise, is at levels that do not adversely affect the marine environment.
The MSRL includes the following implementation steps (1):
- The initial assessment of the current environmental status of national marine waters and the environmental impact and socio-economic analysis of human activities in these waters
- The determination of what GES means for national marine waters
- The establishment of environmental targets and associated indicators to achieve GES by 2020
- The establishment of a monitoring programme for the ongoing assessment and the regular update of targets
- The development of a programme of measures designed to achieve or maintain GES by 2020
- The process is cyclical and the second cycle starts again in 2018.
Marine Protected Areas (MPA): serve descriptor 1, the protection of biological diversity. The establishment of a MPAs network additionally contributes to one of the key objectives of the global Convention on Biological Diversity, the creation of a global network of MPAs.
Sources:
6.2. EU Water Framework Directive (WFD)
In the 1990s, water policy in the European Union was fragmented with respect to objectives and means. The member states agreed on the need for a single piece of framework legislation to resolve these problems and agreed on the following aims (1):
- expanding the scope of water protection to all waters, surface waters and groundwater
- achieving "good status" for all waters by a set deadline
- water management based on river basins
- "combined approach" of emission limit values and quality standards
- getting the prices right
- getting citizens involved more closely
- streamlining legislation
As consequence, the "Directive 2000/60/EC of the European Parliament and of the Council establishing a framework for the Community action in the field of water policy", in short, the EU Water Framework Directive (WFD) was adopted in 2000.
WFD objectives are the general protection of the aquatic ecology, the specific protection of unique and valuable habitats, the protection of drinking water resources, and the protection of bathing water. All these objectives must be integrated for each river basin, including transitional and coastal water.
The WFD goal is to ensure a ‘good status’ in Europe’s rivers, lakes, groundwater bodies and coastal waters. The ecological status of surface waters is defined by the following quality elements:
- Biological quality elements (fish, benthic, invertebrates, aquatic flora)
The following elements only support the biological elements:
- Hydromorphological quality elements (e.g. river bed structure or substrate)
- Physicochemical quality elements (thermal, oxygenation and nutrient conditions)
- Chemical quality elements (environmental quality standards for pollutants)
The WFD classification scheme for surface water ecological status includes five categories: high, good, moderate, poor and bad. ‘High status’ means no or very low human pressure. ‘Good status’ means a ‘slight’ deviation from this condition (2).
A common implementation strategy has been developed to ensure a joint WFD implementation. A separate guidance document provides definitions and explains the implementation process for the surface water categories ‘Transitional and Coastal Waters’ (3):
“Transitional waters are bodies of surface water in the vicinity of river mouths which are partly saline in character as a result of their proximity to coastal waters but which are substantially influenced by freshwater flows.”
“Coastal water means surface water on the landward side of a line, every point of which is at a distance of one nautical mile on the seaward side from the nearest point of the baseline from which the breadth of territorial waters is measured, extending where appropriate up to the outer limit of transitional waters.”
Surface water bodies sub-divide transitional and coastal waters. They are the smallest management unit of the WFD.
Surface water types: “For each surface water category, the relevant surface water bodies within the river basin district shall be differentiated according to type.” These types are defined by factors such as latitude, longitude, tidal range, salinity or optional factors like depth, current velocity, water residence time, mean water temperature or turbidity (System B).
Reference conditions are a description of the biological quality elements at high status.
The implementation timetable include the following major actions:
- To identify the individual river basins lying within their national territory and assign them to River Basin Districts (RBDs) and identify competent authorities
- To characterise river basin districts in terms of pressures, impacts and economics of water uses, including a register of protected areas lying within the river basin district
- To carry out, jointly and together with the European Commission, the intercalibration of the ecological status classification systems
- To make operational the monitoring networks
- Based on sound monitoring and the analysis of the characteristics of the river basin, to identify a programme of measures for achieving cost-effectively the environmental objectives of the WFD
- To produce and publish River Basin Management Plans (RBMPs) for each RBD including the designation of heavily modified water bodies
- To implement water pricing policies that enhance the sustainability of water resources
- To make the measures of the programme operational
- To implement the programmes of measures and achieve the environmental objectives by 2015
The implementation timetable was much too ambitious and the implementation process is still ongoing.
Sources:
- http://ec.europa.eu/environment/water/water-framework/info/intro_en.htm
- http://ec.europa.eu/environment/pubs/pdf/factsheets/water-framework-directive.pdf
- https://circabc.europa.eu/sd/a/85912f96-4dca-432e-84d6-a4dded785da5/Guidance%20No%205%20-%20characterisation%20of%20coastal%20waters%20-%20COAST%20(WG%202.4).pdf
6.3. EU Bathing Water Directive
The European bathing water legislation, the 'Bathing Water Directive' was adopted in 1976. Its main objectives are to safeguard public health and protect the aquatic environment in coastal and inland areas from pollution. Bathing waters can be coastal waters, transitional waters, rivers or lakes. A revised and updated Bathing Water Directive was adopted in 2006 (1).
According to (1) the new Directive intensions are:
- to be based on scientific knowledge on protecting public health and the environment, as well as environmental management experience;
- to provide better and earlier information to citizens about quality of their bathing waters, including logos;
- to move from simple sampling and monitoring of bathing waters to bathing quality management, and
- to be integrated into all other EU measures protecting the quality of all our waters (rivers, lakes, ground waters and coastal waters) through the Water Framework Directive.
Intestinal enterococci and Escherichia coli (E. coli) are the parameters that are used to monitor and assess the quality of bathing waters and to classify them. Other parameters could be taken into account, such as the presence of cyanobacteria or microalgae (1).
Member States are obliged to monitor the bathing waters every year. The monitoring calendar should provide for at least four samples to be taken per season. The sampling interval should not be longer than one month. Upon the monitoring results gathered in four years, Member States should assess the bathing waters at the end of every season (1).
The waters are classified according to their level of quality: poor, sufficient, good or excellent, linked to clear numerical quality standards for bacteriological quality. The category "sufficient" is the minimum quality threshold that all Member States should attain by the end of the 2015 season at the latest. Where water is classified as "poor", Member States should take certain management measures, e.g. banning bathing or posting a notice advising against it, providing information to the public, and suitable corrective measures (1).
Intestinal enterococci and Escherichia coli (E. coli): are common ubiquitous bacteria in the intestines and feces of humans. They can survive for some time in the environment and have been adopted as indicators of human fecal pollution in water.
6.4. EU Biodiversity Strategy
In 2011, the EU adopted its Biodiversity Strategy setting out 6 targets and 20 actions to halt the loss of biodiversity and ecosystem services in the EU by 2020 (1).
Target 1 - Protect species and habitats: with the Birds and Habitats Directives, the EU has laws to ensure that species native to the EU and the habitats they depend on are protected. To prevent further loss and restore biodiversity in the EU, the Birds and Habitats Directives must be fully implemented in all Member States. This means reaching a favourable conservation status of all habitats and species of European importance and adequate populations of naturally occurring wild bird species. By 2020, the assessments of species and habitats protected by the EU nature law must show better conservation or a secure status for 100 % more habitats and 50 % more species, compared to recent assessments (EU 2010 biodiversity baseline) (1).
Target 2 - Maintain and restore ecosystems: aims to maintain and restore ecosystems and their services by including green infrastructure in spatial planning and restoring at least 15 % of degraded ecosystems by 2020. This will contribute to the EU's sustainable growth and help mitigate and adapt to climate change. It will promote economic, territorial and social cohesion and safeguard our cultural heritage (1).
Target 3 - Achieve more sustainable agriculture and forestry: The EU has already made efforts to integrate biodiversity into the development and implementation of other policies. However, given the benefits that biodiversity and ecosystem services bring to sectors such as agriculture and forestry, these efforts are still not sufficient. By 2020, there must be a measurable improvement, compared to the EU2010 biodiversity baseline, in the conservation of species and habitats depending on or affected by agriculture and forestry, and in the provision of their ecosystem services (1).
Target 4 - Make fishing more sustainable and seas healthier: The fishing sector depends on healthy marine biodiversity, but current fishing practices are not always sustainable. The EU strives to integrate biodiversity into the development and implementation of other policies. However, given the benefits that biodiversity and ecosystem services bring to many sectors, these efforts are still not sufficient. Target 4 requires that fishing is sustainable and that fish stocks are healthy. Fishing must have no significant adverse impacts on species and ecosystems so that all European oceans and seas can be ecologically diverse and dynamic, as well as clean, healthy and productive by 2020 (1).
Target 5 - Combat invasive alien species: Alien species are animals and plants introduced accidentally or deliberately into a natural environment where they are not normally found. Such species can become invasive in their new environment if they start spreading and causing serious damage to native species and ecosystems. Invasive alien species represent a major threat to Europe's native biodiversity and cause economic damage worth billions of euros every year. This threat and damage is likely to increase in the future unless decisive and coordinated action is taken to control the pathways of their introduction, prevent their establishment and spread, and manage already established populations (1).
Target 6 - Help stop the loss of global biodiversity: The EU has pledged to meet the international 2020 biodiversity goals and objectives agreed to under the Convention on Biological Diversity. Target 6 requires that, by 2020, the EU steps up its contribution to avert global biodiversity loss by greening its economy and endeavouring to reduce its pressure on global biodiversity.
6.5. Habitats Directive & Natura 2000
Adopted in 1992, the ‘Council Directive 92/43/EEC of 21 May 1992 on the conservation of natural habitats and of wild fauna and flora’ (Habitats Directive) aims to promote the maintenance of biodiversity, taking account of economic, social, cultural and regional requirements. Together with the Birds Directive, it forms a major element of Europe's nature conservation policy and establishes the EU wide Natura 2000 ecological network of protected areas, safeguarded against potentially damaging developments (1). Additionally, the Habitats Directive is a core element in implementing the EU Biodiversity Strategy.
Over 1000 animal and plant species, as well as 200 habitat types are protected in several ways (1):
- Core areas of their habitat are designated and included in the Natura 2000 network. These sites must be managed in accordance with the ecological needs of the species (Annex II species, about 900)
- A strict protection regime must be applied across their entire natural range within the EU, both within and outside Natura 2000 sites (Annex IV species, over 400, including many annex II species)
- Member States must ensure that their exploitation and taking in the wild is compatible with maintaining them in a favourable conservation status (Annex V species, over 90)
Natura 2000 sites have been designated specifically to protect core areas for a sub-set of species or habitat types listed in the Habitats and Birds Directives. They are deemed to be of European importance because they are endangered, vulnerable, rare, endemic or present outstanding examples of typical characteristics of one or more of Europe’s nine biogeographical regions. In total, there are around 2 000 species and 230 habitat types for which core sites need to be designated as Natura 2000 sites (2).
Nature reserves, national parks or other nationally or regionally protected sites are, on the other hand, established exclusively under national or regional law, which can vary from country to country. Sites may be designated for a range of different purposes and may also concern species/ habitats other than those targeted by the Natura 2000 network.
They do not have the same status as Natura 2000 sites. Nevertheless, it may be that some nationally or regionally protected sites are also designated as Natura 2000 sites because they are important areas for species and habitats of EU importance as well. In such cases, the provisions of the EU directives apply, unless stricter rules are in place under national law (2).
Until 2018, the 28 EU member States protected 18 % (1.34 million km²) of the total territory (4.35 million km²) in nearly 28 000 single sites under Natura 2000. The marine areas covered 41 % (0.55 million km²) and the terrestrial areas 59 % (3).
Sources:
- http://ec.europa.eu/environment/nature/legislation/habitatsdirective/index_en.htm
- http://ec.europa.eu/environment/nature/natura2000/faq_en.htm
- https://www.eea.europa.eu/themes/biodiversity/document-library/natura-2000/natura-2000-network-statistics/natura-2000-barometer-statistics/statistics/barometer-statistics
6.6. EU Common Fisheries Policy (CFP)
The European Common Fisheries Policy (CFP) introduced already in the 1970s, aims to ensure that fishing and aquaculture are environmentally, economically and socially sustainable and that they provide a source of healthy food. Its goal is to foster a dynamic fishing industry and ensure a fair standard of living for fishing communities (1).
It recognizes the importance to maximise catches, but within limits. The CFP shall ensure that fishing practices does not harm the ability of fish populations to reproduce. The current policy shall stipulate that between 2015 and 2020 catch limits should be set that are sustainable and maintain fish stocks in the long term (1).
Since the impact of fishing on the fragile marine environment is not fully understood, the CFP wants to adopt a cautious approach which recognises the impact of human activity on all components of the ecosystem. It shall seek to make fishing fleets more selective in what they catch, and to phase out the practice of discarding unwanted fish (1). The CFP has 4 main policy areas:
- Fisheries management: The principal aim is to ensure high long-term fishing yields for all stocks. This is referred to as maximum sustainable yield. Fisheries management includes input controls, such as rules on access to waters (to control which vessels have access to which waters and areas); fishing effort controls (to limit fishing capacity and vessel usage); technical measures (to regulate gear usage and where and when fishermen can fish). It includes output controls which consist of limiting the amount of fish from a particular fishery, in particular through total allowable catch (TAC) quotas (2).
- International policy: More than 20% of EU vessels´ catches are taken outside of EU waters. 9.3% of EU catches (2014-18) are made in the EEZ of third countries engaged with the EU in fishing agreements, 2.2% in other third countries, while another 10% are taken from the high seas, mainly tropical tunas. As a major fishing power, and the largest single market for fisheries products in the world, the EU also plays an important role in promoting better governance through a number of international organisations. Most important is the United Nations Convention on the Law of the Sea (UNCLOS) (3).
- Market and trade policy: The ‘Common Organisation of the Markets’ shall strengthen the role of the actors: producers shall become responsible for ensuring the sustainable exploitation of natural resources and equipped with instruments to better market their products. Consumers shall receive more and better information on the products sold on the EU market, which, regardless of their origin, must comply with the same rules (4).
- Funding of the policy: For the long-term EU budget 2021-2027, the Commission is proposing over €6 billion under a simpler, more flexible fund for European fisheries and the maritime economy.
Aquaculture, namely farming finfish, shellfish and aquatic plants accounts for about 20% of fish production and directly employs about 85 000 people. The EU intends to boost the aquaculture sector through the CFP mainly by reducing administrative burdens, improving access to space and water, increasing competitiveness as well as exploiting competitive advantages due to high quality, health and environmental standards (5).
The CFP points out the importance of fisheries conservation measures for the protection of the marine environment. However, in practice it is criticised e.g. for being overcentralized, not protecting fish stocks effectively, or allowing fishermen to dump billions of dead fish because of being too small or the wrong species (6).
Sources:
- https://ec.europa.eu/fisheries/cfp_en
- https://ec.europa.eu/fisheries/cfp/fishing_rules
- https://ec.europa.eu/fisheries/cfp/international/international_agreements
- https://ec.europa.eu/fisheries/cfp/market
- https://ec.europa.eu/fisheries/cfp/aquaculture
- https://www.debatingeurope.eu/focus/arguments-for-and-against-the-common-fisheries-policy/#.XSWY7-gzaF4
6.7. EU Climate Change Strategy
The ‘EU strategy on adaptation to climate change’ was adopted in 2013. The strategy aims to make Europe more climate-resilient. By taking a coherent approach and providing for improved coordination, it aims to enhance the preparedness and capacity of all governance levels to respond to the impacts of climate change (1).
According to a report of the European Environment Agency (2017), past and projected impacts of climate change in European coastal zones and regional seas are:
- Sea-level rise: Mean and extreme sea level have increased globally and along most coasts in Europe. The global mean sea level rise in the 21st century is very likely to be greater than that of the 20th century. Several recent model-based studies and expert assessments have suggested an upper bound for the global mean sea level rise in the 21st century in the range of 1.5–2.0 m. Projected sea level rise, possible changes in the frequency and intensity of storm surges, and the resulting coastal erosion are expected to cause significant ecological damage, economic loss and other societal problems along low-lying coastal areas across Europe unless additional adaptation measures are implemented.
- Ocean acidity: Ocean surface pH has declined from 8.2 to below 8.1 over the industrial era as a result of the increase in atmospheric CO2 This decline corresponds to an increase in oceanic acidity of about 30 %. Ocean surface pH is projected to decrease to values between 8.05 and 7.75 by the end of 21st century, depending on future CO2 emissions levels. The largest projected decline represents more than a doubling in acidity. Ocean acidification is affecting marine organisms and this could alter marine ecosystems.
- Surface temperatures: All European seas have warmed considerably since 1870, and the warming has been particularly rapid since the late 1970s. The multi-decadal rate of sea surface temperature rise during the satellite era (since 1979) has been between 0.21 °C per decade in the North Atlantic and 0.40 °C per decade in the Baltic Sea. Globally averaged sea surface temperature is projected to increase continually, although more slowly than atmospheric temperature.
- Ocean oxygen content: Dissolved oxygen in sea water affects the metabolism of species. Therefore, reductions in oxygen content (i.e. hypoxic or anoxic areas) can lead to changes in the distribution of species, including so called 'dead zones'. The number of 'dead zones' has roughly doubled every decade since the 1960s and has increased from about 20 in the 1950s to about 400 in the 2000s. Oxygen-depleted zones in the Baltic Sea have increased more than 10-fold, from 5 000 to 60 000 km2, since 1900. The Baltic Sea now has the largest dead zone in the world. Oxygen depletion has also been observed in other European seas in recent decades. The primary cause of oxygen depletion is nutrient input from agricultural fertilisers, causing eutrophication. The effects of eutrophication are exacerbated by climate change, in particular increases in sea temperature and in water-column stratification.
Consequences of climate change are e.g. northward expansion of fish and plankton species, increasing risk for fish stocks or changes in phytoplankton communities.
Water-borne diseases are affected by climate change and have strong impacts on society. Examples are the number of vibriosis infections, which can be life-threatening, has increased substantially in Baltic Sea states since 1980. This increase has been linked to observed increases in sea surface temperature, which has improved environmental conditions for Vibrio species blooms in marine waters. The unprecedented number of vibriosis infections in 2014 has been attributed to the unprecedented 2014 heat wave in the Baltic region. Increased temperatures could increase the risk of salmonellosis and the risk of campylobacteriosis and cryptosporidiosis could increase in those regions where precipitation or extreme flooding is projected to increase.
Sources:
6.8. EU Floods Directive
Directive 2007/60/EC on the assessment and management of flood risks (EU Floods Directive) entered into force in 2007. This Directive requires EU Member States to assess:
- if water courses and coast lines are at risk from flooding,
- to map the flood extent, assets and humans at risk in these areas and
- to take adequate and coordinated measures to reduce this flood risk.
The Directive shall be carried out in coordination with the Water Framework Directive, notably by flood risk management plans and river basin management plans being coordinated, and through coordination of the public participation procedures in the preparation of these plans. All assessments, maps and plans prepared shall be made available to the public (1).
The EU Floods Directive is a consequence of climate change and has to be regarded in connection with the ‘EU strategy on adaptation to climate change’. Background for the Directive was a report by the European Environment Agency (EEA) concluding that the number and impacts of disasters have increased in Europe in the period 1998-2009. For example, during this period, Europe suffered over 213 major damaging floods, including the catastrophic floods along the Danube and Elbe rivers in summer 2002. The floods have caused some 1 126 deaths, the displacement of about half a million people and at least €52 billion in insured economic losses (2).
Sources:
6.9. Regional Sea Conventions (RSC)
The Regional Seas Conventions (RSC) are cooperation structures set up to protect the marine environment of a specific marine region. The four European RSC are (1):
- OSPAR Convention (OSPAR): The Convention for the Protection of the Marine Environment in the North-East Atlantic - updated in 1992
- Helsinki Convention (HELCOM): The Convention on the Protection of the Marine Environment in the Baltic Sea Area - updated in 1992
- Barcelona Convention (UNEP-MAP): The Convention for the Protection of Marine Environment and the Coastal Region of the Mediterranean - updated in 1995
- Bucharest Convention: The Convention for the Protection of the Black Sea of 1992
RSC shall support the implementation of EU environmental policy in general and of the Marine Strategy Framework Directive in specific in at least three ways (1):
- by improving regional and cross-regional coherence of national implementation
- by making the RSCs’ long-standing experience and established structures for cooperation available to increase the efficiency and effectiveness of national implementation and
- by offering practical opportunities for the mobilisation and coordination of relevant third countries’ activities.
7. Baltic Sea Region (BSR)
Some basic facts about the Baltic Sea Region (BSR) after various sources (1):
Baltic catchment area: about 2,100,000 km²
Shoreline length: about 8,000 km
Population in catchment: 85 Million people in 14 countries
Baltic Sea surface area: about 420,000 km2
Average depth: 55 m
Maximum depth: 459 m
Water volume: 22,000 km3
Water residence time: about 30 years
Water budget: The annual mean precipitation exceeds evaporation by about 40 km3a-1 and is a net source of fresh water for the Baltic Sea. With 436 km3a-1, the mean annual river discharge is more than 10 times higher and the most important source of fresh water. This amount is comparable to the total inflow of saline water from the North Sea (2).
The Baltic Sea water budget, pollution and state is largely controlled by riverine inputs. Major rivers are:
- Neva: catchment area: 287,000 km2; water discharge: 67 km3a-1; population 6.1 million
- Vistula: catchment area: 193,000 km2; water discharge: 42 km3a-1; population 23.5 million
- Daugava: catchment area: 86,000 km2; water discharge: 21 km3a-1; population 2.8 million
- Nemunas: catchment area: 92,000 km2; water discharge: 20 km3a-1; population 4.9 million
- Oder/Odra: catchment area: 117,000 km2; water discharge: 16 km3a-1; population 16.2 million.
Salinity: The Baltic Sea is one of the largest brackish water areas in the world. Its surface water salinity gradually changes from 15 - 18 psu (1.5 - 1.8%) in the southwest (the Sound between Denmark and Sweden), 7 - 8 psu in the cental Baltic Sea (Baltic Proper) and 0 - 2 psu in the northeast (Bothnian Bay) (1).
Geology: The Baltic Sea is geologically a very young sea. It was formed after the Weichselian Glaciation (about 12,000 years ago) when the Scandinavian ice sheet retreated. Afterwards it has gone through different salinity states from freshwater to marine. The present state, with a connection to the North Sea, only developed 7,500 and 4,000 years before present, during the Littorina transgression (1).
Sources:
7.1. Baltic Sea - Blue Growth
In 2014, the European Commission adopted ‘A Sustainable Blue Growth Agenda for the Baltic Sea Region’. Aim is to support transnational cooperation to enable sustainable growth of the maritime economy in the Baltic Sea Region (BSR) by raising mutual understanding, creating ownership and stimulating the systematic interplay between the various actors throughout the region.
Focus topics are (1):
- Blue Bio-economy
- Shipping (short sea, shipbuilding, maritime technologies, satellite, big data)
- Environmental & Monitoring Technology
- Tourism & Maritime Experience Industry
A recent report presents the results of stakeholder dialogues in the region on how to implement the processes necessary to realise the Baltic Blue Growth Agenda in the region (1). For the funding of related activities, the Interreg Programmes play an important role:
The Interreg Baltic Sea Region Programme supports integrated territorial development and cooperation for a more innovative, better accessible and sustainable Baltic Sea region. Within transnational projects, partners from countries around the Baltic Sea can work together. In the funding period 2014-2020, the thematic focus was on “Capacity for Innovation”, “Efficient Management of Natural Resources” and “Sustainable Transport” (2).
The Interreg South Baltic Programme supports the cross-border cooperation between local and regional actors from Denmark, Germany, Lithuania, Poland and Sweden within projects. The 2014-2020 funding period focussed on Blue and Green Growth. Blue Growth addresses the economic potential of the Baltic Sea for growth and jobs. Green Growth underlines the need to pursue the path of economic growth in balance with the environment, in particular by utilising South Baltic’s rich natural and cultural heritage in a sustainable and preserving manner (3).
The Interreg Central Europe Programme enables central European countries, including Poland and Germany, to cooperate within projects. (4).
The European Neighbourhood Instrument enables cross-border projects between Latvia, Lithuania and Belarus (5).
Sources:
7.2. Baltic Sea - Spatial Planning
The Baltic Sea is bordered by eight EU member states (Denmark, Germany, Poland, Lithuania, Latvia, Estonia, Finland, Sweden) and Russia. It is divided into six marine regions: Gulf of Finland, Gulf of Bothnia, Gulf of Riga, Baltic Proper, Danish Straits and Kattegat.
Visions and Strategies Around the Baltic Sea (VASAB): VASAB is an intergovernmental multilateral co-operation of 10 countries of the Baltic Sea Region (BSR), including Belarus) on spatial planning and development. Its current work is guided by the 2009 ‘VASAB Long-Term Perspective for the Territorial Development of the Baltic Sea Region’ strategic document, which considers MSP as a key instrument for the alleviation of potential sea use conflicts (1).
Helsinki Commission (HELCOM): HELCOM (Baltic Marine Environment Protection Commission - Helsinki Commission) is the governing body of the Convention on the Protection of the Marine Environment of the Baltic Sea Area, known as the Helsinki Convention. In 2007, HELCOM developed the Baltic Sea Action Plan (BSAP) which introduced MSP as a process aiming at more coherent management of human activities in the Baltic Sea (1).
HELCOM-VASAB MSP Working Group: The working group serves as forum for intergovernmental discussions on MSP. The Working Group hosts dialogues on recent and future developments in the field of MSP in the Baltic Sea Region (1). In 2010, the ‘HELCOM-VASAB Baltic Sea Broad–scale Maritime Spatial Planning Principles’ were adopted, fulfilling the commitment set out in the Baltic Sea Action Plan on creating MSP principles. Aim of the ten principles is to provide guidance for achieving better coherence in the development of MSP systems in the Baltic Sea Region (2):
- Sustainable management
- Ecosystem approach
- Long term perspective and objectives
- Precautionary Principle
- Participation and Transparency
- High quality data and information basis
- Transnational coordination and consultation
- Coherent terrestrial and maritime spatial planning
- Planning adapted to characteristics and special conditions at different areas
- Continuous planning
To fulfill the goal of drawing up and applying maritime spatial plans throughout the Baltic Sea region which are coherent across borders and apply the ecosystem approach, a roadmap was created, the “The Regional Baltic Maritime Spatial Planning Roadmap”. The “Guideline for the implementation of ecosystem-based approach in MSP in the Baltic Sea area” presents a step towards a common understanding on how the ecosystem-based approach can be applied in drawing up a spatial plan for a sea area in accordance with spatial planning legislation in force in Baltic Sea countries (2).
EU Strategy for the Baltic Sea Region (EUSBR): EUSBR is a macro-regional strategy, approved by the European Council in 2009. The strategy is divided into three objectives which represent the three key challenges of the strategy: 1. saving the sea, 2. connecting the region and 3. increasing prosperity. The strategy defines the “Horizontal Action Spatial Planning” which covers MSP and land based spatial planning. The aims reflect the HELOCOM-VASAB objectives (3).
Sources:
7.3. Baltic Sea - Helsinki Convention
HELCOM is the governing body of the Helsinki Convention. The first Helsinki Convention was published in 1974. The modified Helsinki Convention of 1992 was signed by the contracting parties Denmark, Estonia, the European Union, Finland, Germany, Latvia, Lithuania, Poland, Russia and Sweden and entered into force in 2000 (1).
“HELCOM was established to protect the marine environment of the Baltic Sea from all sources of pollution through intergovernmental cooperation. HELCOM's vision for the future is a healthy Baltic Sea environment with diverse biological components functioning in balance, resulting in a good ecological status and supporting a wide range of sustainable economic and social activities” (1).
HELCOM sees itself as:
- “an environmental policy maker for the Baltic Sea area by developing common environmental objectives and actions
- an environmental focal point providing information about the state of and trends in the marine environment, the efficiency of measures to protect it and common initiatives and positions, which can form the basis for decision-making in other international fora
- a body for developing, according to the specific needs of the Baltic Sea, recommendations of its own and recommendations supplementary to measures imposed by other international organisations
- a supervisory body dedicated to ensuring that HELCOM environmental standards are fully implemented by all parties throughout the Baltic Sea and its catchment area
- a coordinating body, ascertaining multilateral response in case of major maritime incidents.”
HELCOM has eight main working groups that implement policies and strategies as well as propose issues for discussion at the meetings of the heads of delegations, where decisions are made. The heads of delegation represent the contracting parties and form the Helsinki Commission which meets annually. The groups are:
- GEAR - Group on the implementation of the ecosystem approach supports region-wide co-operation on all elements of national marine strategies (2).
- MARITIME - Group to prevent any pollution from ships – including deliberate operational discharges as well as accidental pollution (3).
- PRESSURE - Group provides the necessary technical basis to the work on inputs of nutrients and hazardous substances from both diffuse and point sources on land, including follow-up of the implementation of the HELCOM nutrient reduction scheme (4).
- RESPONSE - Group works to ensure swift national and international response to maritime pollution incidents (5).
- STATE AND CONSERVATION – Group covers monitoring and assessment functions as well as issues related to nature conservation and biodiversity protection in HELCOM (6).
- FISH – Group deals with fisheries in relation to the implementation of the ecosystem-based approach (7).
- AGRI - Group enhances dialogue between agricultural and environmental authorities on the development and application of sustainable agricultural practices with the least environmental impact on the Baltic Sea (8).
- Maritime spatial planning - a joint HELCOM-VASAB group established to ensure cooperation among the Baltic Sea Region countries for coherent regional MSP processes in the Baltic Sea.
Sources:
- http://www.helcom.fi/about-us
- http://www.helcom.fi/helcom-at-work/groups/gear
- http://www.helcom.fi/helcom-at-work/groups/maritime
- http://www.helcom.fi/helcom-at-work/groups/pressure
- http://www.helcom.fi/helcom-at-work/groups/response
- http://www.helcom.fi/helcom-at-work/groups/state-and-conservation
- http://www.helcom.fi/helcom-at-work/groups/fish-group
- http://www.helcom.fi/helcom-at-work/groups/agri-group
7.4. Baltic Sea Action Plan (BSAP) - Major Problems
HELCOM Baltic Sea Action Plan (BSAP) has the vision of a healthy Baltic Sea environment, with diverse biological components functioning in balance, resulting in good environmental/ecological status and supporting a wide range of sustainable human economic and social activities. The Plan, adopted by all the coastal states and the EU in 2007, aims to restore the good ecological status of the Baltic marine environment and provides a concrete basis for HELCOM work. It incorporates the latest scientific knowledge and innovative management approaches into strategic policy implementation, and stimulates goal-oriented multilateral cooperation around the Baltic Sea region. The BSAP is regularly updated in ministerial meetings (1).
The BSAP names major problem areas of the Baltic Sea ecosystem:
Eutrophication: “since the 1900s, the Baltic Sea has changed from an oligotrophic clear-water sea into a eutrophic marine environment. Eutrophication is a condition in an aquatic ecosystem where high nutrient concentrations stimulate the growth of algae which leads to imbalanced functioning of the system, such as: intense algal growth: excess of filamentous algae and phytoplankton blooms; production of excess organic matter; increase in oxygen consumption; oxygen depletion with recurrent internal loading of nutrients; and death of benthic organisms, including fish.
Excessive nitrogen and phosphorus loads coming from land-based sources, within and outside the catchment area of the Contracting States, are the main cause of the eutrophication of the Baltic Sea. About 75% of the nitrogen load and at least 95% of the phosphorus load enter the Baltic Sea via rivers or as direct waterborne discharges. About 25% of the nitrogen load comes as atmospheric deposition.” (1).
Hazardous substances: “pollution caused by hazardous substances refers to a massive number of different anthropogenic substances ending up in the marine environment including substances that do not occur naturally in the environment and substances occurring at concentrations exceeding natural levels. Although monitoring indicates that the loads of some hazardous substances have been reduced considerably over the past 20–30 years, problems still persist, and concentrations in the marine environment of some new substances have even increased. Once released into the Baltic Sea, hazardous substances can remain in the marine environment for very long periods and can accumulate in the marine food web up to levels which are toxic to marine organisms. Levels of some hazardous substances in the Baltic Sea exceed concentrations in e.g. the North East Atlantic by more than 20 times. Hazardous substances cause adverse effects on the ecosystem, such as: impaired general health status of animals; impaired reproduction of animals, especially top predators and increased pollutant levels in fish for human food” (1).
Biodiversity and nature conservation. “The Baltic Sea has a unique combination of marine and freshwater species and habitats adapted to brackish conditions. Favourable conservation status of Baltic Sea biodiversity is a prerequisite for the marine ecosystems to be resilient and able to adapt to changing environmental conditions” (1). This is threatened by loss of habitats, over-exploitation of the sea and the sea floor, poor water quality and changing conditions.
Maritime Activities: “The Baltic Sea is one of the most intensively trafficked areas in the world. Both the number and the size of the ships, especially oil tankers, have been growing during the last years, and this trend is expected to continue. This heavy traffic is being carried out within narrow straits and in shallow water, covered with ice for a long period, which makes the Baltic a difficult area to navigate and leads to traffic junctions and an increased risk of shipping incidents.
The main negative environmental effects of shipping and other activities at sea include pollution to the air, illegal and accidental discharge of oil, hazardous substances and other wastes, and introduction of alien organisms via ships’ ballast water and hulls” (1).
7.5. Baltic Sea Action Plan (BSAP) - Aims
BSAP aims are a (1):
- Baltic Sea unaffected by eutrophication: clear water, natural level of algal blooms, natural distribution and occurrence of plants and animals and natural oxygen levels;
- Baltic Sea undisturbed by hazardous substances: concentrations of hazardous substances close to natural levels, all fish are safe to eat, healthy wildlife and radioactivity at the pre-Chernobyl level;
- favourable status of Baltic Sea biodiversity: natural marine and coastal landscapes, thriving and balanced communities of plants and animals and viable populations of species;
- environmentally friendly maritime activities: enforcement of international regulations and no illegal discharges, safe maritime traffic without accidental pollution, efficient emergency and response capabilities, minimum sewage pollution from ships, no introductions of alien species from ships, minimum air pollution from ships, zero discharges from offshore platforms, minimum threats from offshore installations.
The BASP includes a large amount of concrete actions to reach these objectives. One of the most important is the provision of Maximum Allowable Inputs (MAI) of the nutrients nitrogen and phosphorus. It indicates the maximal level of inputs of water- and airborne nitrogen and phosphorus to Baltic Sea sub-basins that can be allowed to fulfil the targets for non-eutrophied sea. This is complemented by Country-Allocated Reduction Targets (CART), indicating how much nutrient inputs the HELCOM countries need to reduce comparing to a reference period (1997-2003). The up-dated BSAP (2013) defines the years 1997-2003 as reference years with an input of 910,344 t total nitrogen and 36,894 t total phosphorus. It demands a load reduction of 118,134 t total nitrogen (13%) and 15,178 t total phosphorus (41%) (2).
EU Water Framework Directive (WFD) and the BSAP share many similarities. The BSAP can be regarded as approach to expand the WFD from coastal waters to an entire sea. The BSAP is an approach to implement EU environmental policy, mainly the WFD, in a comprehensive way. It is updated from time to time, to ensure that problems and new challenges are addressed adequately.
The BSAP already addresses several of the 11 qualitative descriptors determining the Good Environmental Status (GES) according to the EU Marine Strategy Framework Directive (MSFD), such as eutrophication, contaminants or biological diversity. For all 11 descriptors HELCOM collects data and publishes reports on the state of the Baltic Sea environment. This enables HELCOM in future, to expand the BSAP towards problems such as marine litter or underwater noise. The environmental policy and management of the Baltic Sea is an outstanding example worldwide and serves as a blueprint for other regional European seas.
Sources:
7.6. Baltic Sea - State
The HELCOM report “State of the Baltic Sea” (1) provides an update on the environmental situation in the Baltic Sea for the period 2011–2016:
Eutrophication: 97 % of the Baltic Sea area is affected by eutrophication and 12 % is assessed as being in the worst status category. Inputs of nutrients from land have decreased, but the effect of these measures are not yet generally reflected in the status of the marine environment. The eutrophication status has deteriorated in four out of the seventeen open sea assessment units since the last five year period (2007–2011), and improved in one. Only a few coastal areas are currently unaffected by eutrophication, but an improving trend is seen in some indicators and sub-basins.
Hazardous substances: Levels of contaminants are elevated and continue to give cause for concern. However, the number of improving trends outweighs the number of deteriorating trends in the monitored hazardous substances. The integrated contamination status is mainly influenced by polybrominated fame retardants and mercury, together with cesium, deposited after the accident at the Chernobyl nuclear power plant in 1986. Levels of radionuclides are now at acceptable levels in some sub-basins and can be expected to be so in all of the Baltic Sea by 2020. Acute pollution events from oils spills have decreased.
Marine litter: HELCOM is developing core indicators for assessing marine litter, but they are not yet operational and thus no assessment of status has been possible at this time. Beach litter monitoring is ongoing in several countries, showing that the number of beach litter items ranges from around 50 on reference beaches to up to 300 on urban beaches, per 100 metres of shoreline. Plastic litter is a special concern due to its risk to the environment and its slow rate of degradation. Around 70 % of the litter items in the Baltic Sea are derived from plastic materials.
Underwater sound: Underwater sound is a widely distributed pressure in the Baltic Sea, caused by various human activities. Areas with high levels of continuous sound mainly coincide with areas of high vessel traffic. Up to 1 700 impulsive sound events were registered in 2011-2016. The majority of these stem from explosions, whilst around 11 % are linked to pile driving in connection to construction work. It is not known how many marine species are impacted by underwater sound, and thus no assessment of status has been possible at this time.
Non-indigenous species: Around 140 non-indigenous species have so far been recorded in the Baltic Sea. Of these, 12 are new for the Baltic Sea during 2011–2016. In addition, an unknown number of previously arrived non-indigenous species have expanded their distribution range to new sub-basins in the Baltic Sea. The regional objective is that there should be no primary introductions of non-indigenous species due to human activities during an assessment period and thus, good status is not achieved.
Species removal by fishing and hunting: Three out of nine assessed commercial fish stocks are in good status with respect to both biomass and fishing mortality rates. Eight stocks are currently lacking an evaluation with respect to both of these aspects. Hunting of marine mammals and birds is minor. Seals are generally protected, but hunting is permitted in some countries, restricted to populations above a limit reference level and with a positive growth rate. Water birds are hunted in some countries, whereas in others they have strict protection.
Seabed loss and disturbance: Less than one percent of the Baltic Sea seabed was estimated as potentially lost due to human activities, while roughly 40 % of the Baltic Sea seabed was estimated as potentially disturbed during the assessment period. The estimates are based on the spatial extent of human activities but have not been linked to pressure intensity. Hence, no assessment of adverse effects on the seabed has been made at this time.
Habitats: For benthic habitats, there is indication of good status in six of thirteen assessed open sea areas, based on estimates limited to soft bottom habitats. Coastal areas show good status in about one third of the assessed Baltic Sea region. Pelagic habitats are assessed based on core indicators representing primary productivity, and in some sub-basins also zooplankton. Based on the available indicators, open-sea pelagic habitats achieve good status only in the Kattegat. Coastal pelagic habitats show good integrated status in about one fifth of the assessed areas. The assessments of habitats are still under development and additional elements will be included in the future.
Fish: The assessment of fish from a biodiversity perspective indicates good status in about half of the assessed coastal areas. In the open sea, good status is achieved only in the Bothnian Bay. Two out of five assessed pelagic fish stocks (herring in the central Baltic Sea and the Gulf of Bothnia) have good status, and one of four assessed demersal stocks (plaice). Core indicators for the migratory species salmon and sea trout show mixed results with strong geographical differences. Eel is critically endangered.
7.7. Baltic Sea - Trends & Challenges
The environmental health of the Baltic Sea is not sufficient, and still does not meet the objectives of the BSAP. However, the measures taken so far, such as cutting nutrient inputs and pollution and working to protect biodiversity, are showing some effects on the state of the Baltic Sea environment. It is obvious that some measures already put into operation have not yet been in place long enough to have an effect. For measures such as the reduction of nutrient loads it will take several decades before the full effects can be measured in the environment (1). However, the Baltic Sea Region is a dynamic area with new trends and challenges, for example:
Wind farms: at present, there are 13 wind farms in the Baltic Sea, situated in Denmark, Germany, Sweden and Finland. Until 2030 the number could increase to 67 offshore wind farms and may cover an area of about 2,500 km2. Challenges are the competition for space and ecological consequences. For example, wind farm cause underwater noise but can also act as artificial reefs that attract several marine species (2).
Pollution: in 1992, HELCOM listed 162 major pollution hot spots in the Baltic Sea Region. In 2019, 19 industrial hot spots and 23 municipal or combined municipal and industrial sites are still on the list (1). The levels of several hazardous substances, including PCBs, dioxins and furans, have been reduced considerably over the past 20 years (2) but problems still persist and new substances are introduced and require ongoing policy actions.
Shipping: the Baltic Sea is one of the most heavily trafficked seas in the world, accounting for up to 15% of the world’s cargo transportation. Each month there are around 3 500 to 5,000 ships on the waters of the Baltic Sea. The number of ships is expected to double by 2030 and the size of ships is expected to increase substantially as well. The number of cruise ships is increasing, as well, with a growing trend for the use of larger ships and more international cruisers (2). Major problems are risks of accidents and emissions. Nitrogen oxide emissions from ships is an important nitrogen source for the Baltic Sea. Ships built after 2020 will have to use new technology, resulting in circa 80 % lower nitrogen oxide emissions. From 2021, sewage discharges from passenger ships will only be allowed into port reception facilities, or alternatively at sea after treatment with advanced on-board sewage treatment plants which reduces the nutrient content of the sewage (1).
Marine protected areas (MPA): 12 % of the Baltic Sea is protected through marine protected areas and the Baltic Sea is worldwide leading in this respect. Offshore areas are strongly under-represented. Challenges are to establish MPAs covering at least 10 % of the offshore area, to establish an ecologically coherent network of MPAs and to implement management plans for all sites.
Other important topics with strong dynamic and/or the need for policy action are tourism, commercial fisheries, aquaculture, sand, gravel and oil extraction or physical exploitation. The examples show that there is an increasing pressure from human uses and activities on the Baltic Sea and an increasing competition for space. Many uses require an intact environment. The importance of the Baltic Sea marine environment to society is shown by economic and social analyses. The results illustrate the contribution from the use of marine waters to the economies and the impact of the state of the marine environment on the welfare of citizens. An important challenge is to improve our understanding of the connection between the marine ecosystem and human welfare (1). Ecosystem service assessment is a suitable approach for this purpose.
Sources:
7.8. Baltic Sea - Climate Change
Climate Change is a major challenge in the Baltic Sea Region. The report “climate change in the Baltic Sea Area HELCOM thematic assessment” (1) provides an overview:
Surface air temperatures “have overall shown a significant increase in the Baltic Sea region over the past 140 years. Since 1871, the annual mean temperature trends show an increase of 0.11 °C per decade north of 60°N and 0.08 °C south of 60°N, while the trend of the global mean temperature was about 0.05 °C per decade for the period 1861 to 2000. The daily temperature cycle is also changing and there has been an increase in temperature extremes. These changes are resulting in changes in the seasons: the length of the growing season has increased, whereas the length of the cold season has decreased. In future, the largest warming was projected for the north in winter. The increase in winter daily mean temperatures will be most pronounced in the coldest periods, while warm extremes in summer are also expected to become more pronounced than at present” (1).
Surface water temperatures “in the Baltic Sea increased in all seasons since 1985. The annual mean sea-surface temperature has been estimated to have increased by up to 1 °C/decade from 1990 to 2008, with the greatest increase in the northern Bothnian Bay. The annual maximum ice extent of the Baltic Sea decreased by 20% and the length of the ice season in the Bothnian Bay, decreased by 18 days during the last century. In future, the summer sea-surface temperature increase is likely to be about 2 °C in the southern parts of the Baltic Sea and about 4 °C in the northern parts near the end of this century” (1).
Precipitation in the “Baltic Sea area during the past century has varied between regions and seasons, with both increasing and decreasing precipitation. Model projections indicate that precipitation will increase in the entire Baltic Sea runoff region during winter, while in the summer increases in precipitation are mainly projected only for the northern half of the basin. In a future warmer climate, extremes of precipitation are projected to increase, implying a greater risk of urban flooding, among other impacts” (1).
Sea-surface salinity shows a decrease. This “may be largest in the region of the Danish straits, especially in the Belt Sea, and small in the northern and eastern Baltic, with the smallest change in the Bothnian Bay” (1).
Sea-level rise is projected to increase between 0.6 m and 1.1 m sea-level rise for the Baltic Sea over the 21st century. In some areas this is compensated by vertical land movement which varies between 0 m/century in Denmark and 0.8 m/century in the Bothnian Bay (1).
Climate change has and will have multiple consequences on the Baltic Sea ecosystem, examples are:
“A temperature increase is expected to result in a change in the species composition and length of the spring phytoplankton bloom season. Changes in the composition of the spring bloom community will also influence the benthos. The projected changes in temperature and particularly salinity are likely to influence the zooplankton community composition, with potential negative consequences for the food conditions and growth of the main plankton-eating fish, Baltic herring and sprat” (1).
“A projected continued decrease in salinity in the future will have a major effect on the distribution of benthic species, with a continued retreat of marine species towards the south.” “Oxygen deficiency is the single most important environmental factor causing habitat loss and reducing the biodiversity of benthic invertebrates….The ‘business-as-usual’ nutrient input scenario yielded an increase of the anoxic area by more than a factor of two, while a moderate increase of about 30% was obtained for the hypoxic area” (1).
“In the littoral zone, the potential decrease in salinity may affect key species such as seagrasses. Some species such as the eelgrass Zostera marina may disappear from areas such as the Gulf of Finland”. Blue mussel communities may face a decrease in growth rate and a spatial shift further to the south-western Baltic Sea (1). “Climate change may have positive effects on littoral vegetation. Milder winters with less coastal sea ice will reduce the scraping of ice in the uppermost part of the algal belt that removes key species” (1).